---
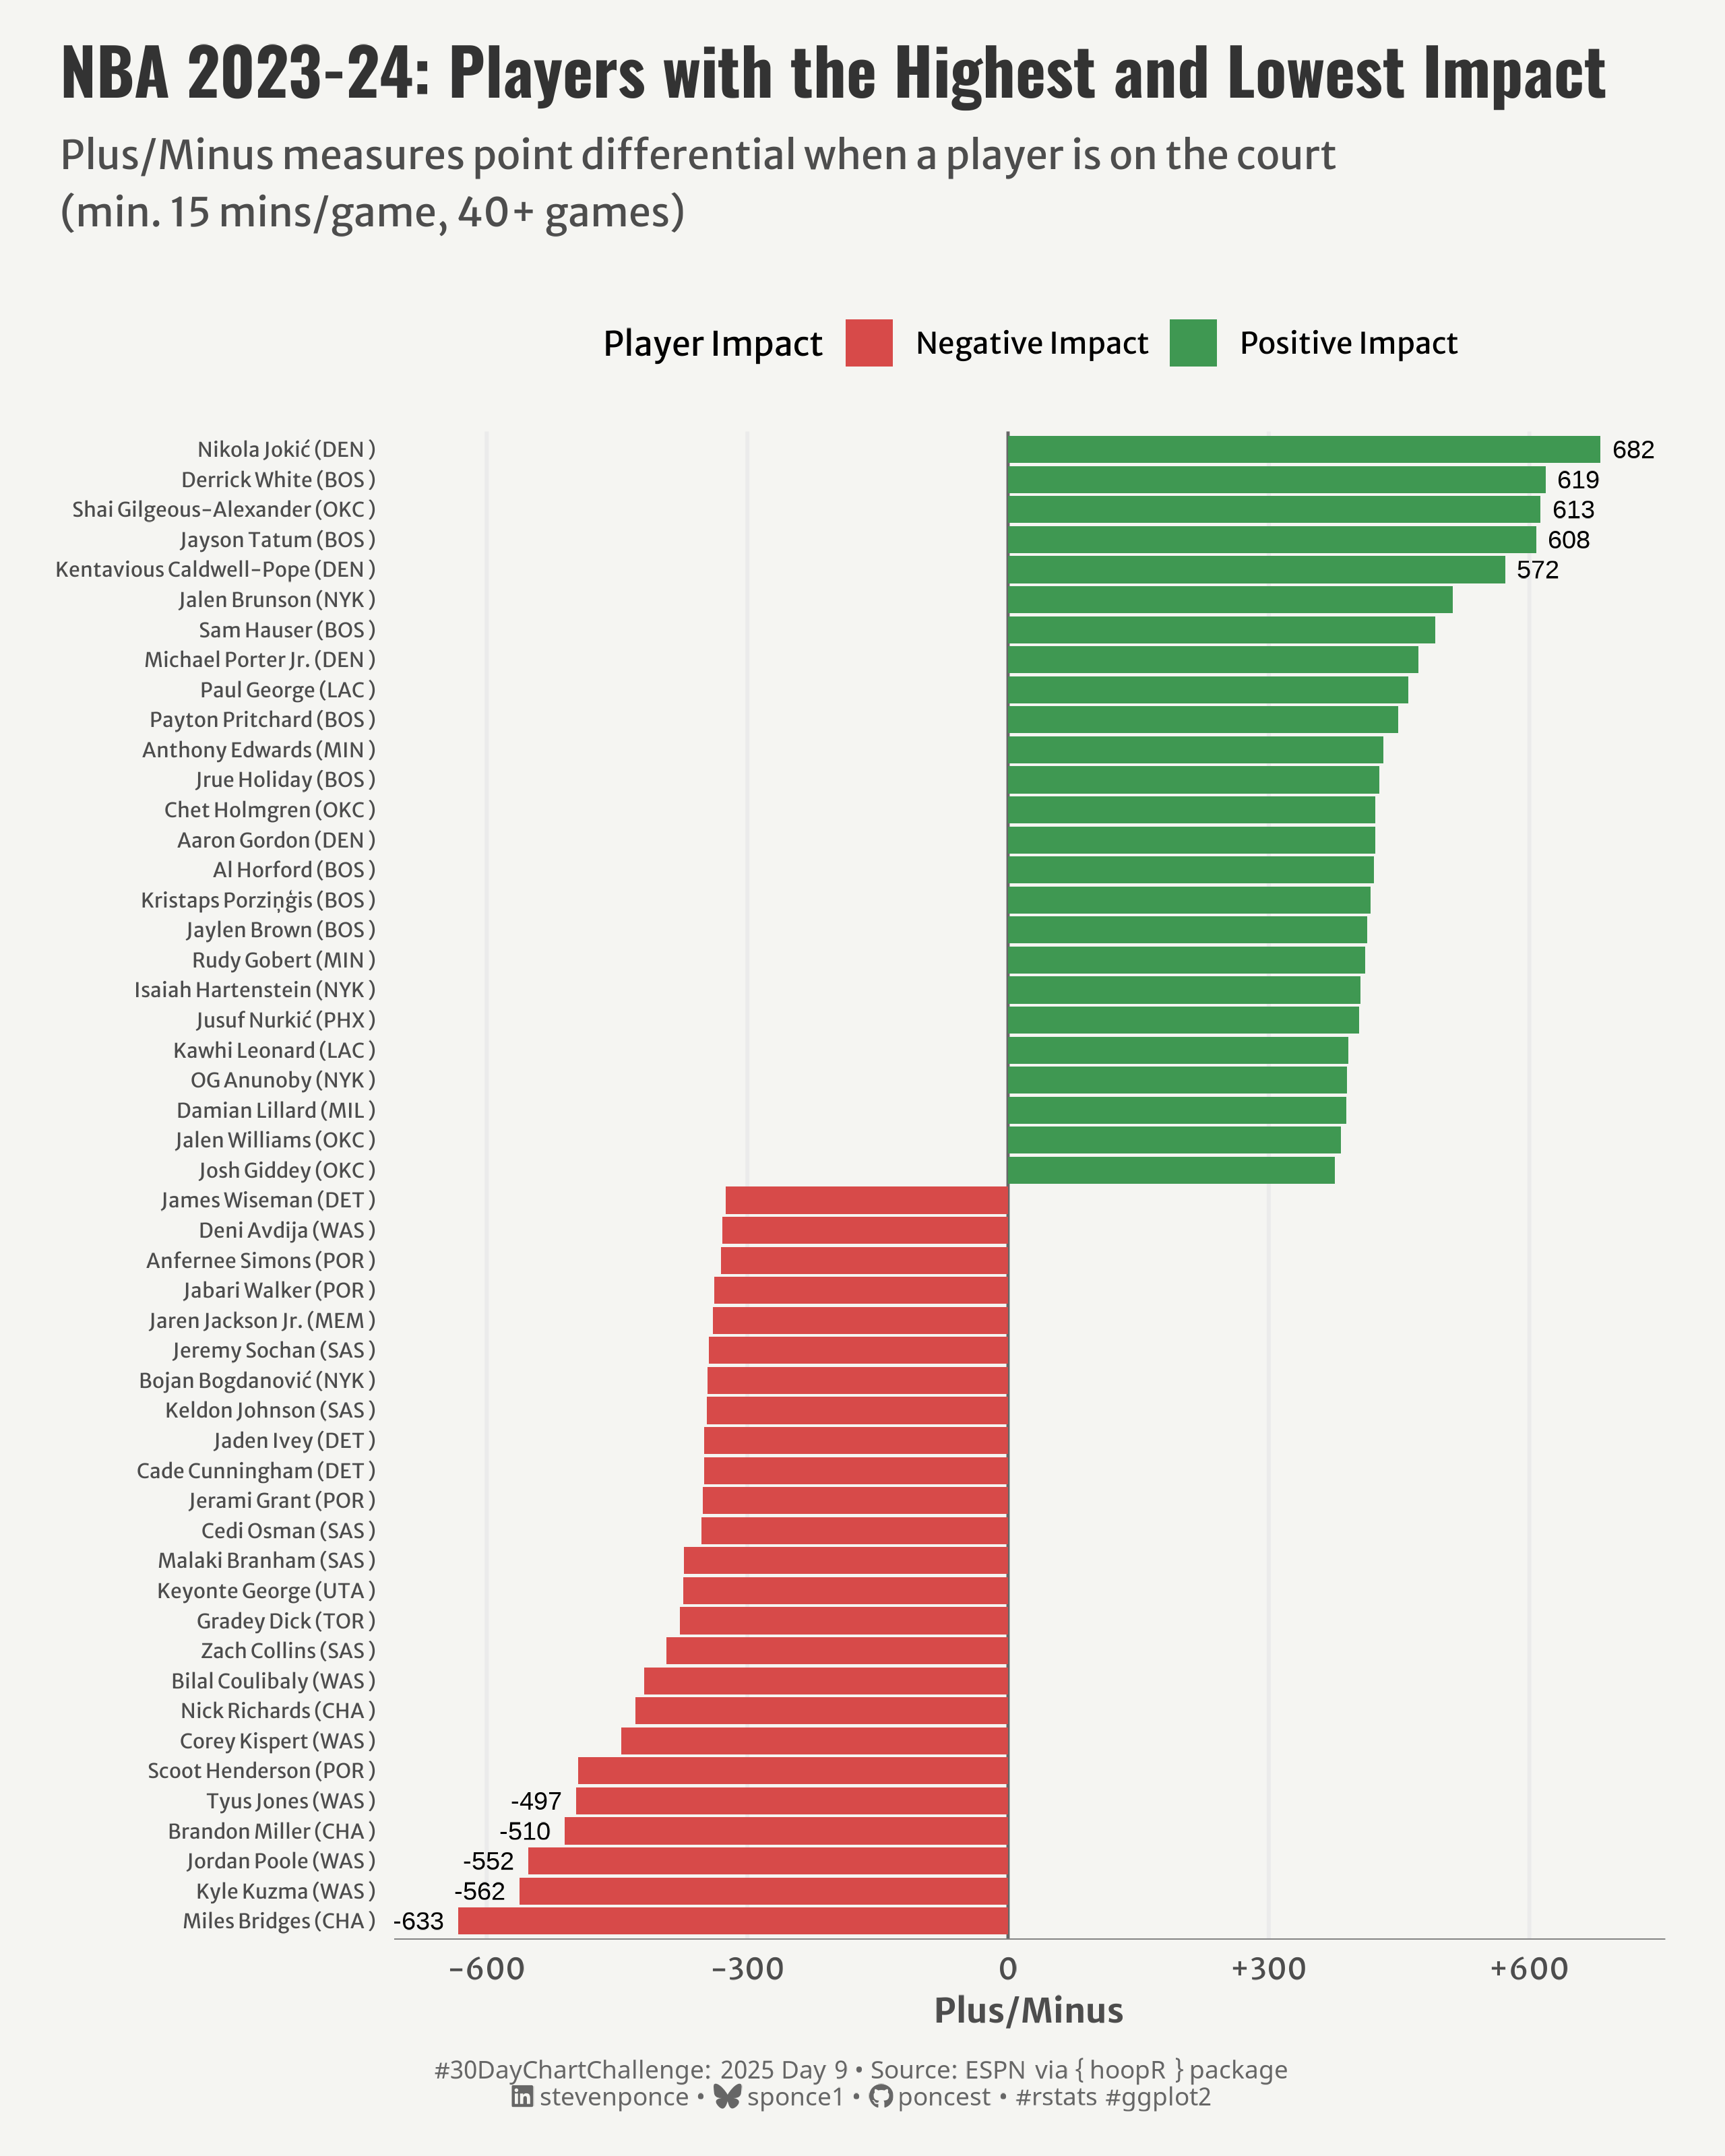
title: "NBA 2023-24: Players with the Highest and Lowest Impact"
subtitle: "Plus/Minus measures point differential when a player is on the court (min. 15 mins/game, 40+ games)"
description: "Visualizing the NBA players with the greatest positive and negative impacts on their teams during the 2023-24 season using Plus/Minus statistics. Day 9 of the #30DayChartChallenge focusing on distribution and diverging charts."
author: "Steven Ponce"
date: "2025-04-09"
categories: ["30DayChartChallenge", "2025"]
tags: [
"NBA", "Basketball", "Sports Analytics", "hoopR", "ggplot2", "Plus/Minus", "Player Impact", "Distribution", "Diverging Chart"
]
image: "thumbnails/30dcc_2025_09.png"
format:
html:
toc: true
toc-depth: 5
code-link: true
code-fold: true
code-tools: true
code-summary: "Show code"
editor_options:
chunk_output_type: inline
execute:
freeze: true
cache: true
error: false
message: false
warning: false
eval: true
# filters:
# - social-share
# share:
# permalink: "https://stevenponce.netlify.app/data_visualizations/30DayChartChallenge/2025/30dcc_2025_09.html"
# description: "Check out my visualization of NBA player impact using Plus/Minus statistics! Who had the biggest positive and negative influence on their teams in the 2023-24 season? #DataVisualization #NBA #30DayChartChallenge"
# twitter: true
# linkedin: true
# email: true
# facebook: false
# reddit: false
# stumble: false
# tumblr: false
# mastodon: true
# bsky: true
---
{#fig-1}
### <mark> **Steps to Create this Graphic** </mark>
#### 1. Load Packages & Setup
```{r}
#| label: load
#| warning: false
#| message: false
#| results: "hide"
## 1. LOAD PACKAGES & SETUP ----
suppressPackageStartupMessages({
pacman::p_load(
tidyverse,      # Easily Install and Load the 'Tidyverse'
  tidyverse,      # Easily Install and Load the 'Tidyverse'
  ggtext,         # Improved Text Rendering Support for 'ggplot2'
  showtext,       # Using Fonts More Easily in R Graphs
  janitor,        # Simple Tools for Examining and Cleaning Dirty Data
  skimr,          # Compact and Flexible Summaries of Data
  scales,         # Scale Functions for Visualization
  lubridate,      # Make Dealing with Dates a Little Easier
  hoopR,          # Access Men's Basketball Play by Play Data
  camcorder       # Record Your Plot History
)
})

### |- figure size ----
gg_record(
    dir    = here::here("temp_plots"),
    device = "png",
    width  = 8,
    height = 10,
    units  = "in",
    dpi    = 320
)

# Source utility functions
suppressMessages(source(here::here("R/utils/fonts.R")))
source(here::here("R/utils/social_icons.R"))
source(here::here("R/utils/image_utils.R"))
source(here::here("R/themes/base_theme.R"))
```
#### 2. Read in the Data
```{r}
#| label: read
#| include: true
#| eval: true
#| warning: false
# Get NBA player stats for 2023-24 season
players_2024_raw <- nba_leaguedashplayerstats(season = "2023-24")
players_2024 <- players_2024_raw$LeagueDashPlayerStats
```
#### 3. Examine the Data
```{r}
#| label: examine
#| include: true
#| eval: true
#| results: 'hide'
#| warning: false
glimpse(players_2024)
skim(players_2024)
```
#### 4. Tidy Data
```{r}
#| label: tidy
#| warning: false
### |- Tidy ----
players_2024 <- players_2024 |>
  mutate(
    PLUS_MINUS = as.numeric(PLUS_MINUS),
    GP = as.numeric(GP),
    MIN = as.numeric(MIN)
  )

# Players with with at least 15 minutes per game and 40 games
filtered_players <- players_2024 |>
  filter(MIN >= 15, GP >= 40)

# plot df
plot_data <- filtered_players |>
  select(PLAYER_NAME, TEAM_ABBREVIATION, GP, MIN, PLUS_MINUS) |>
  arrange(desc(PLUS_MINUS)) |>
  # Get top and bottom 25 players by PLUS_MINUS
  mutate(rank_group = case_when(
    row_number() <= 25 ~ "Top 25",
    row_number() > n() - 25 ~ "Bottom 25",
    TRUE ~ "Middle"
  )) |>
  filter(rank_group != "Middle") |>
  # Add player names with team abbreviation
  mutate(
    player_label = str_glue("{ PLAYER_NAME } ({ TEAM_ABBREVIATION } )"),
    player_label = fct_reorder(player_label, PLUS_MINUS),
    highlight = ifelse(PLUS_MINUS > 0, "Positive Impact", "Negative Impact")
    )

# labels df
top_5 <- plot_data |>
  arrange(desc(PLUS_MINUS)) |>
  head(5)

bottom_5 <- plot_data |>
  arrange(PLUS_MINUS) |>
  head(5)

label_data <- bind_rows(top_5, bottom_5)
```
#### 5. Visualization Parameters
```{r}
#| label: params
#| include: true
#| warning: false
### |- plot aesthetics ----
colors <- get_theme_colors(
  palette = c("Negative Impact" = "#D74A49", "Positive Impact" = "#3F9852")
  )

### |-  titles and caption ----
# text
title_text    <- str_glue("NBA 2023-24: Players with the Highest and Lowest Impact")
subtitle_text <- str_wrap("Plus/Minus measures point differential when a player is on the court (min. 15 mins/game, 40+ games)",
                          width = 70)

# Create caption
caption_text <- create_dcc_caption(
  dcc_year = 2025,
  dcc_day = 09,
  source_text =  "ESPN via { hoopR } package"
)

### |-  fonts ----
setup_fonts()
fonts <- get_font_families()

### |-  plot theme ----

# Start with base theme
base_theme <- create_base_theme(colors)

# Add weekly-specific theme elements
weekly_theme <- extend_weekly_theme(
  base_theme,
  theme(
    # Text styling
    plot.title = element_text(face = "bold", family = fonts$title, size = rel(1.14), margin = margin(b = 10)),
    plot.subtitle = element_text(family = fonts$subtitle, color = colors$text, size = rel(0.78), margin = margin(b = 20)),

    # Axis elements
    axis.title = element_text(color = colors$text, size = rel(0.8)),
    axis.text = element_text(color = colors$text, size = rel(0.7)),
    axis.text.y = element_text(color = colors$text, size = rel(0.68)),

    axis.line.x = element_line(color = "gray50", linewidth = .2),

    # Grid elements
    panel.grid.minor.x = element_blank(),
    panel.grid.major.y = element_blank(),

    # Legend elements
    legend.position = "top",
    legend.title = element_text(family = fonts$text, size = rel(0.8)),
    legend.text = element_text(family = fonts$text, size = rel(0.7)),

    # Plot margins
    plot.margin = margin(t = 10, r = 20, b = 10, l = 20),
  )
)

# Set theme
theme_set(weekly_theme)
```
#### 6. Plot
```{r}
#| label: plot
#| warning: false
### |-  Plot ----
p <- ggplot(
  data = plot_data,
  aes(x = player_label, y = PLUS_MINUS, fill = highlight)) +
  # Geoms
  geom_hline(yintercept = 0, color = "gray40", linetype = "solid", linewidth = 0.5) +
  geom_col() +
  geom_text(
    data = label_data,
    aes(label = round(PLUS_MINUS, 0),
        hjust = ifelse(PLUS_MINUS > 0, -0.3, 1.3)),
    color = "black",
    size = 3
  ) +
  # Scales
  scale_fill_manual(
    values = colors$palette,
    name = "Player Impact"
  ) +
  scale_y_continuous(
    name = "Plus/Minus",
    labels = function(x) paste0(ifelse(x > 0, "+", ""), x),
    breaks = seq(-600, 600, 300),
    limits = c(-640, 690)
  ) +
  coord_flip() +
  # Labs
  labs(
    title = title_text,
    subtitle = subtitle_text,
    caption = caption_text,
    x = NULL
  ) +
  # Theme
  theme(
    plot.title = element_text(
      size = rel(1.55),
      family = fonts$title,
      face = "bold",
      color = colors$title,
      margin = margin(t = 5, b = 5)
    ),
    plot.subtitle = element_text(
      size = rel(0.95),
      family = fonts$subtitle,
      color = colors$subtitle,
      lineheight = 1.2,
      margin = margin(t = 5, b = 20)
    ),
    plot.caption = element_markdown(
      size = rel(0.6),
      family = fonts$caption,
      color = colors$caption,
      lineheight = 0.65,
      hjust = 0.5,
      halign = 0.5,
      margin = margin(t = 10, b = 5)
    ),
  )
```
#### 7. Save
```{r}
#| label: save
#| warning: false
### |-  plot image ----

save_plot(
  p,
  type = "30daychartchallenge",
  year = 2025,
  day = 09,
  width = 8,
  height = 10
  )
```
#### 8. Session Info
::: {.callout-tip collapse="true"}
##### Expand for Session Info
```{r, echo = FALSE}
#| eval: true
#| warning: false
sessionInfo()
```
:::
#### 9. GitHub Repository
::: {.callout-tip collapse="true"}
##### Expand for GitHub Repo
The complete code for this analysis is available in [`30dcc_2025_09.qmd`](https://github.com/poncest/personal-website/blob/master/data_visualizations/TidyTuesday/2025/30dcc_2025_09.qmd).
For the full repository, [click here](https://github.com/poncest/personal-website/).
:::
#### 10. References
::: {.callout-tip collapse="true"}
##### Expand for References
1. Data Sources:
- ESPN via { hoopR } package: [hoopR](https://github.com/sportsdataverse/hoopR)
:::
