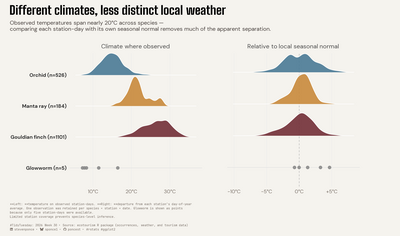
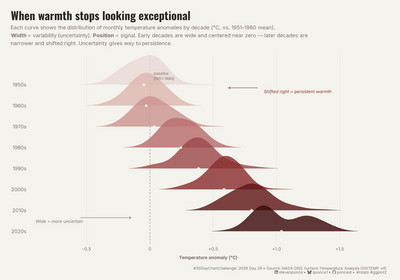
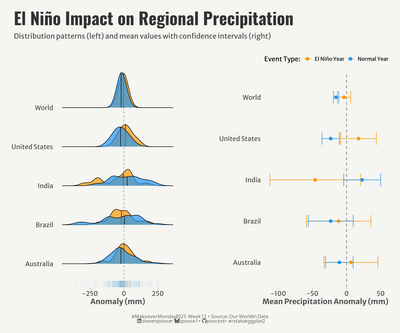
• Steven Ponce
  • About
  • Data Visualizations
  • Projects
  • Email

On this page

  • Data Visualization Portfolio
Categories
All (102)
2024 (26)
2025 (76)
30DayChartChallenge (30)
Data Visualization (102)
Exercise (5)
MakeoverMonday (14)
R Programming (102)
SWDchallenge (14)
TidyTuesday (44)

Data Visualizations

Portfolio
Data Visualization
A showcase of data visualization projects using R, featuring TidyTuesday challenges and custom analytics visualizations
Author

Steven Ponce

Modified

June 18, 2025

Data Visualization Portfolio

Welcome to my data visualization gallery. Here you’ll find a collection of visualizations created using R, primarily focusing on #TidyTuesday, #30DayChartChallenge, #SWDchallenege, and #MakeoverMonday challenges and personal projects.

The API Graveyard: A Tale of Digital Neglect
June 17, 2025

Diversity in Federal Judicial Appointments Has Increased Over Time
June 12, 2025

Project Gutenberg: Language Patterns in Author Longevity
June 3, 2025

From 17x Industry Benchmark to Optimized Efficiency: A Data-Driven Supplier Strategy
June 2, 2025

The Stakes for U.S. Truck Manufacturing Under Shifting Federal Policy
June 2, 2025

D&D Encounter Design: Celestials Dominate Skill-Based Challenges
May 26, 2025

Client Contact Program: Uneven Success Demands Strategic Response
May 23, 2025

The Enduring Legacy of PC Gaming Excellence
May 19, 2025

Sydney Beaches: Water Quality Reliability
May 18, 2025

Religious Representation Gap: Migrants vs. General Population
May 14, 2025

Volatility and Change Patterns in Mount Vesuvius Seismic Activity (2011-2023)
May 10, 2025

The Uneven Landscape of Asian Restaurants in the U.S.
May 5, 2025
No matching items
  • 1
  • 2
  • 3
  • ...
Back to top

© 2024 Steven Ponce

Source Issues