---
title: "Gender Differences in Diabetes Rates Vary Sharply by Region"
subtitle: "Values represent the percentage difference between men's and women's diabetes prevalence (age-standardized adults 18+)."
description: "Analysis of WHO data reveals striking regional differences in diabetes prevalence between men and women. While European men have nearly 40% higher diabetes rates than women, African women historically had up to 20% higher rates than men. This visualization explores these gender disparities across continents from 1990-2022."
date: "2025-04-24"
categories: ["30DayChartChallenge", "2025"]
tags: [
"time series", "health data", "gender gap", "WHO", "diabetes", "global health", "regional trends", "ggplot2", "public health", "chronic disease"
]
image: "thumbnails/30dcc_2025_24.png"
format:
html:
toc: true
toc-depth: 5
code-link: true
code-fold: true
code-tools: true
code-summary: "Show code"
editor_options:
chunk_output_type: inline
execute:
freeze: true
cache: true
error: false
message: false
warning: false
eval: true
# filters:
# - social-share
# share:
# permalink: "https://stevenponce.netlify.app/data_visualizations/30DayChartChallenge/2025/30dcc_2025_24.html"
# description: "Day 24 of #30DayChartChallenge: Time Series - Exploring global gender differences in diabetes prevalence across regions using WHO data"
# twitter: true
# linkedin: true
# email: true
# facebook: false
# reddit: false
# stumble: false
# tumblr: false
# mastodon: true
# bsky: true
---
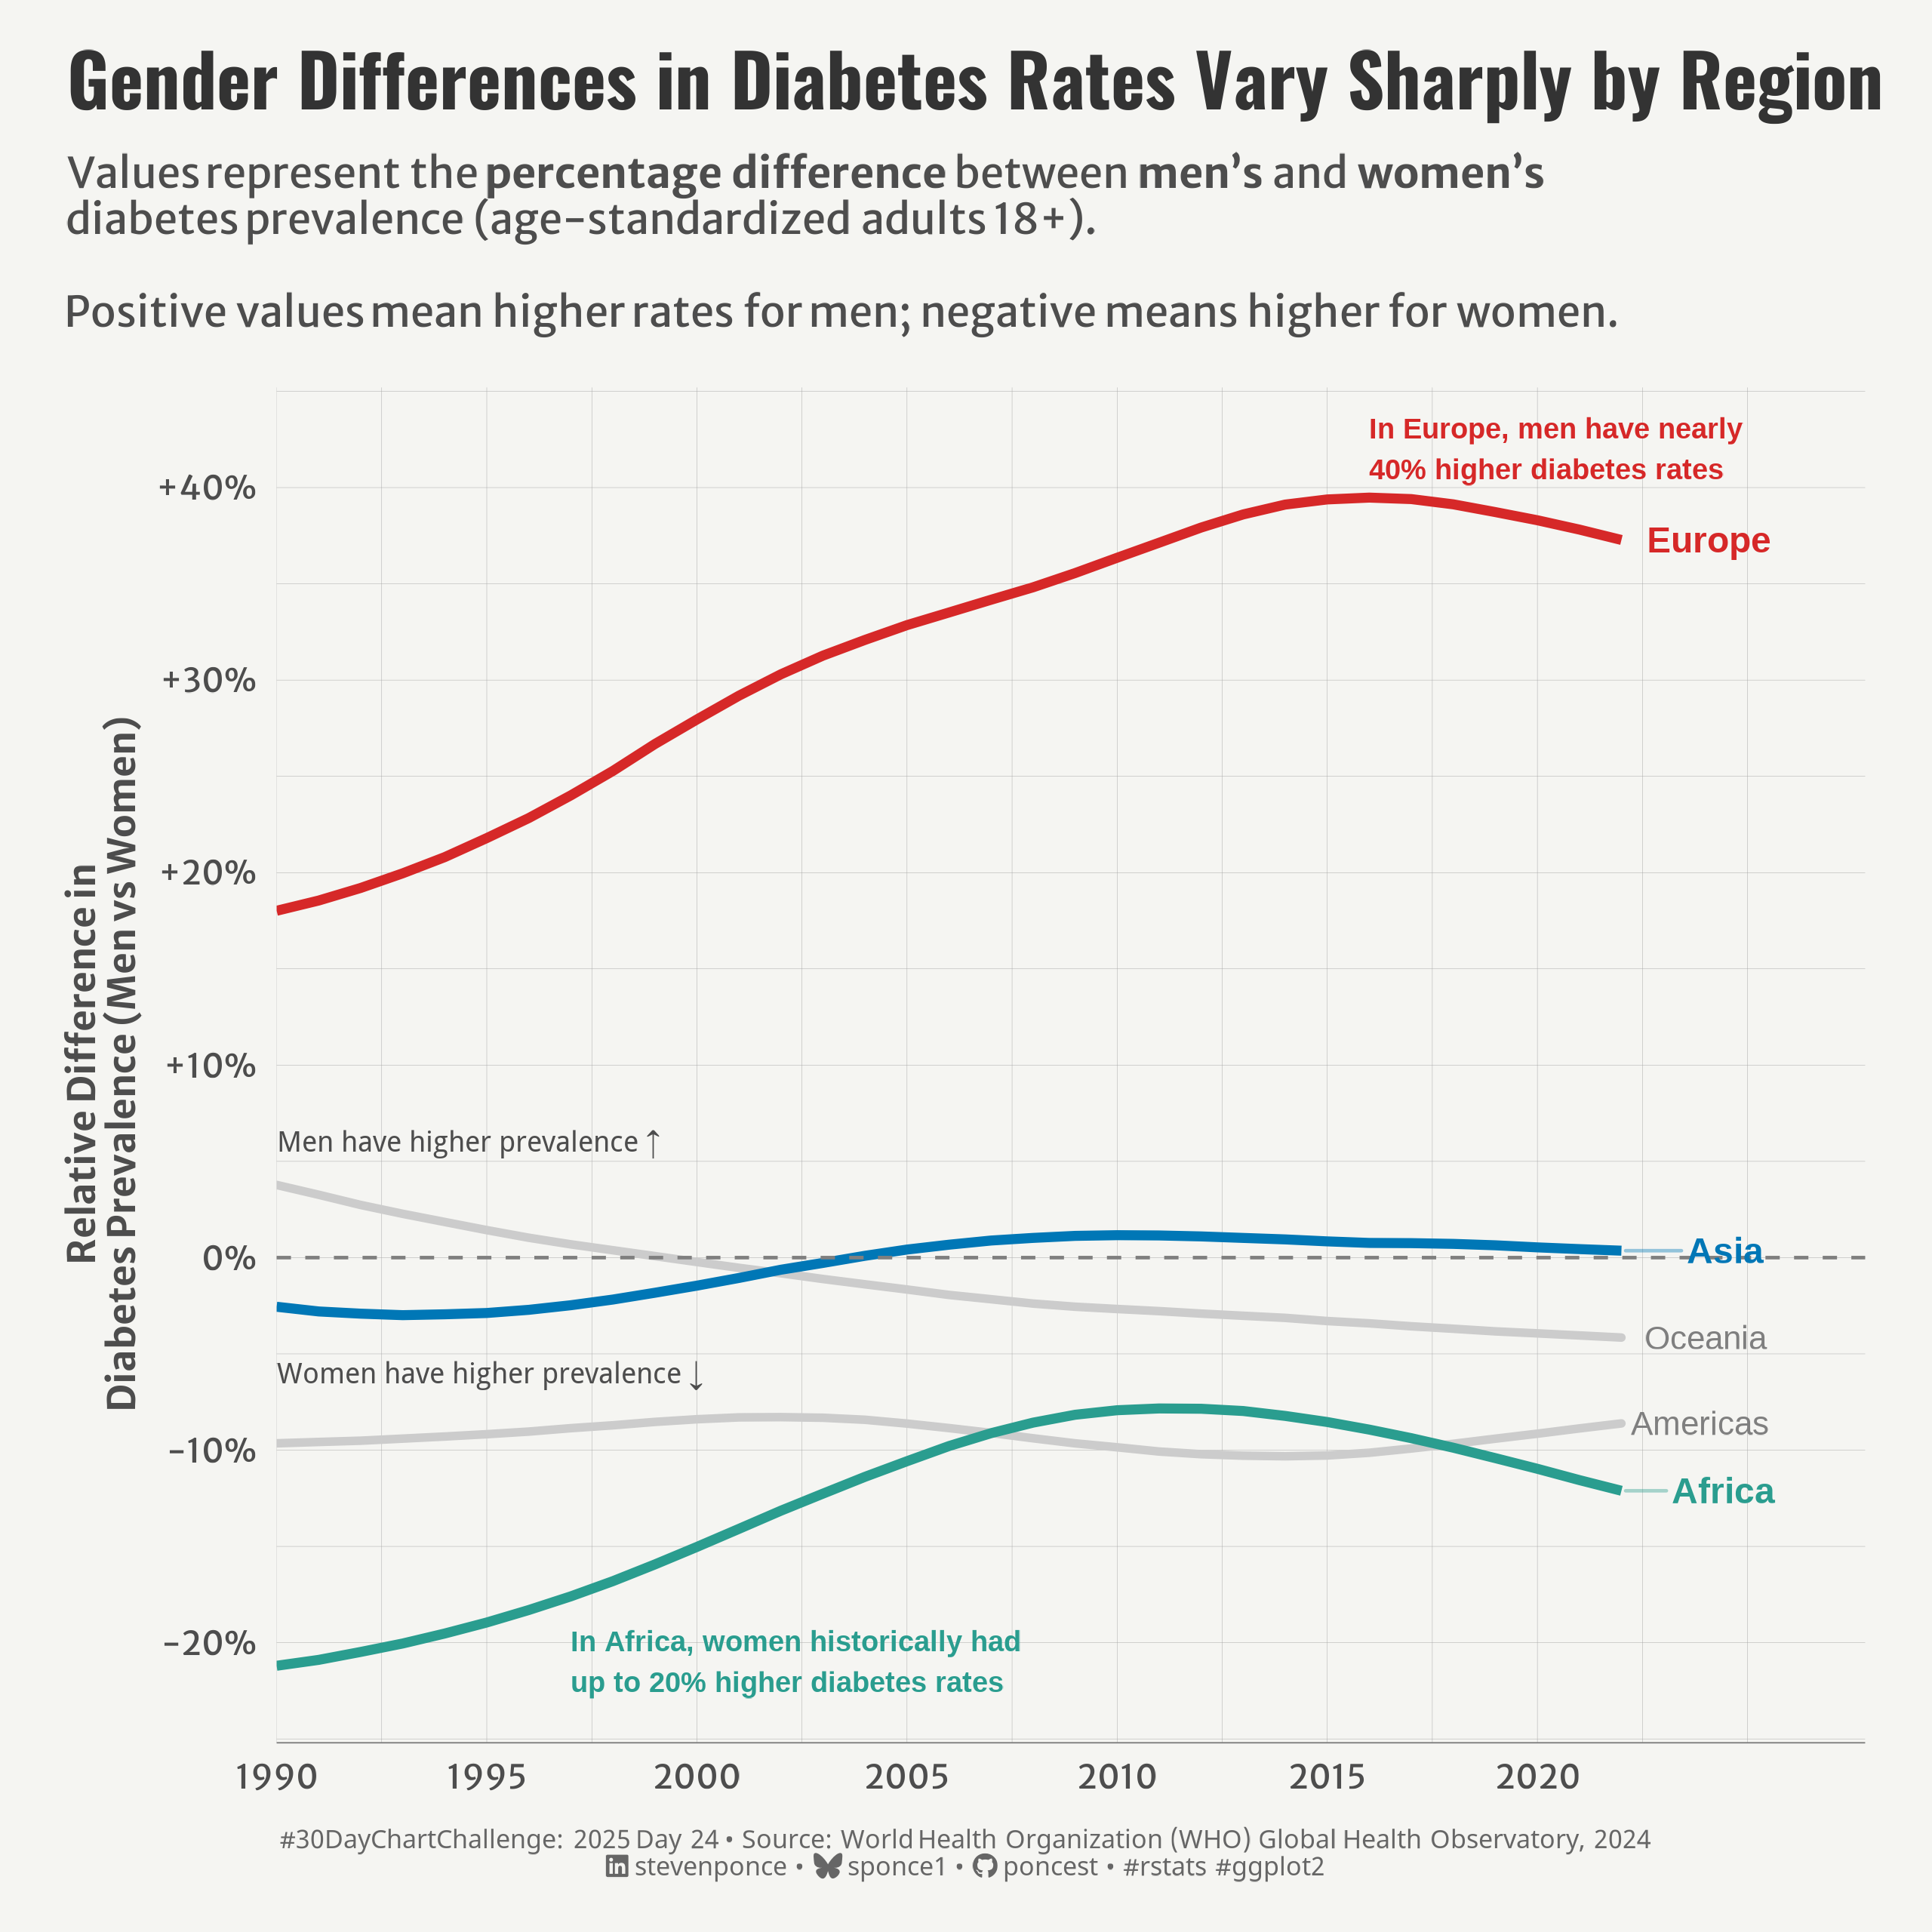{#fig-1}
### <mark> **Steps to Create this Graphic** </mark>
#### 1. Load Packages & Setup
```{r}
#| label: load
#| warning: false
#| message: false
#| results: "hide"
## 1. LOAD PACKAGES & SETUP ----
suppressPackageStartupMessages({
pacman::p_load(
  tidyverse,      # Easily Install and Load the 'Tidyverse'
  ggtext,         # Improved Text Rendering Support for 'ggplot2'
  showtext,       # Using Fonts More Easily in R Graphs
  janitor,        # Simple Tools for Examining and Cleaning Dirty Data
  skimr,          # Compact and Flexible Summaries of Data
  scales,         # Scale Functions for Visualization
  lubridate,      # Make Dealing with Dates a Little Easier
  countrycode,    # Convert Country Names and Country Codes
  ggrepel,        # Automatically Position Non-Overlapping Text Labels with 'ggplot2'
   camcorder      # Record Your Plot History
  )
})

### |- figure size ----
gg_record(
    dir    = here::here("temp_plots"),
    device = "png",
    width  = 8,
    height = 8,
    units  = "in",
    dpi    = 320
)

# Source utility functions
suppressMessages(source(here::here("R/utils/fonts.R")))
source(here::here("R/utils/social_icons.R"))
source(here::here("R/utils/image_utils.R"))
source(here::here("R/themes/base_theme.R"))
```
#### 2. Read in the Data
```{r}
#| label: read
#| include: true
#| eval: true
#| warning: false
diabetes_data_raw <- read_csv(here::here(
  'data/30DayChartChallenge/2025/WHO_prevalence_of_diabetes_3356.csv')) |>
  clean_names()
```
#### 3. Examine the Data
```{r}
#| label: examine
#| include: true
#| eval: true
#| results: 'hide'
#| warning: false
glimpse(diabetes_data_raw)
skim(diabetes_data_raw)
```
#### 4. Tidy Data
```{r}
#| label: tidy
#| warning: false
### |- Tidy ----
diabetes_processed <- diabetes_data_raw |>
  filter(
    indicator == "Prevalence of diabetes, age-standardized",
    dim2 == "18+  years"
  ) |>
  select(location, period, dim1, prevalence = fact_value_numeric) |>
  mutate(
    year = period,
    region = case_when(
      location %in% c("Global", "World") ~ "Global",
      TRUE ~ countrycode(location, "country.name", "continent")
    )
  )

gender_gap_data <- diabetes_processed |>
  filter(dim1 %in% c("Male", "Female")) |>
  pivot_wider(names_from = dim1, values_from = prevalence) |>
  filter(!is.na(Male) & !is.na(Female)) |>
  mutate(relative_difference = (Male - Female) / Female * 100) |>
  filter(!is.na(region)) |>
  group_by(region, year) |>
  summarize(
    avg_relative_difference = mean(relative_difference, na.rm = TRUE),
    .groups = "drop"
    ) |>
  group_by(region) |>
  mutate(
    last_value = if_else(year == max(year), avg_relative_difference, NA_real_),
    highlight = case_when(
      region %in% c("Asia", "Europe", "Africa") ~ "highlight",
      TRUE ~ "base",
    )
  ) |>
  ungroup()

label_colors <- c("Europe" = "#D62828", "Asia" = "#0077B6", "Africa" = "#2A9D8F")

gender_gap_labels <- gender_gap_data |>
  filter(!is.na(last_value), region %in% names(label_colors)) |>
  mutate(label_color = label_colors[region])
```
#### 5. Visualization Parameters
```{r}
#| label: params
#| include: true
#| warning: false
### |-  plot aesthetics ----
colors <- get_theme_colors(
  palette = c("Europe" = "#D62828", "Asia" = "#0077B6", "Africa" = "#2A9D8F")
  )

### |-  titles and caption ----
# text
title_text    <- str_wrap("Gender Differences in Diabetes Rates Vary Sharply by Region",
                          width = 60)

subtitle_text <- str_glue("Values represent the **percentage difference** between **men's** and **women's** <br>
                          diabetes prevalence (age-standardized adults 18+).<br><br>
                          Positive values mean higher rates for men; negative means higher for women.")

caption_text <- create_dcc_caption(
  dcc_year = 2025,
  dcc_day = 24,
  source_text =  "World Health Organization (WHO) Global Health Observatory, 2024"
)

### |-  fonts ----
setup_fonts()
fonts <- get_font_families()

### |-  plot theme ----

# Start with base theme
base_theme <- create_base_theme(colors)

# Add weekly-specific theme elements
weekly_theme <- extend_weekly_theme(
  base_theme,
  theme(
    # Text styling
    plot.title = element_text(face = "bold", family = fonts$title, size = rel(1.14), margin = margin(b = 10)),
    plot.subtitle = element_text(family = fonts$subtitle, color = colors$text, size = rel(0.78), margin = margin(b = 20)),

    # Axis elements
    axis.title = element_text(color = colors$text, size = rel(0.8)),
    axis.text = element_text(color = colors$text, size = rel(0.7)),

    axis.line.x = element_line(color = "gray50", linewidth = .2),

    # Grid elements
    panel.grid.minor = element_line(color = "gray65", linewidth = 0.05),
    panel.grid.major = element_line(color = "gray65", linewidth = 0.05),

    # Plot margins
    plot.margin = margin(t = 10, r = 20, b = 10, l = 20),
  )
)

# Set theme
theme_set(weekly_theme)
```
#### 6. Plot
```{r}
#| label: plot
#| warning: false
### |-  Plot ----
p <- ggplot(gender_gap_data, aes(x = year, y = avg_relative_difference, group = region)) +

  # Geoms
  geom_line(
    data = gender_gap_data |> filter(region %in% c("Americas", "Oceania")),
    color = "gray80", linewidth = 1.2, lineend = "round"
  ) +
  geom_line(data = gender_gap_data |> filter(region == "Asia"), color = colors$palette[2], linewidth = 1.4) +
  geom_line(data = gender_gap_data |> filter(region == "Europe"), color = colors$palette[1], linewidth = 1.4) +
  geom_line(data = gender_gap_data |> filter(region == "Africa"), color = colors$palette[3], linewidth = 1.4) +
  geom_hline(yintercept = 0, linetype = "dashed", color = "gray50") +
  geom_text_repel(
    data = gender_gap_labels,
    aes(label = region, color = label_color),
    xlim = c(2021, 2026),
    size = 3.8, fontface = "bold", hjust = 0,
    direction = "y", nudge_x = 1.5, segment.alpha = 0.4,
    box.padding = 0.4, show.legend = FALSE
  ) +
  # Add gray labels for context lines
  geom_text_repel(
    data = gender_gap_data |>
      filter(!is.na(last_value), region %in% c("Americas", "Oceania")),
    aes(label = region),
    color = "gray50",
    xlim = c(2021, 2026),
    size = 3.5, fontface = "plain", hjust = 0,
    direction = "y", nudge_x = 1.5, segment.alpha = 0.3,
    box.padding = 0.4, show.legend = FALSE
  ) +
  # Annotate
  annotate(
    "text", x = 1990, y = 6, label = "Men have higher prevalence ↑",
     hjust = 0, size = 3, color = "gray30", fontface = "bold"
    ) +
  annotate(
    "text", x = 1990, y = -6, label = "Women have higher prevalence ↓",
    hjust = 0, size = 3, color = "gray30", fontface = "bold"
    ) +
  annotate(
    "text", x = 2016, y = 42,
    label = "In Europe, men have nearly\n40% higher diabetes rates",
    size = 3, color = "#D62828", fontface = "bold", hjust = 0
    ) +
  annotate(
    "text", x = 1997, y = -21,
    label = "In Africa, women historically had\nup to 20% higher diabetes rates",
    size = 3, color = "#2A9D8F", fontface = "bold", hjust = 0
    ) +
  # Scales
  scale_x_continuous(
    breaks = seq(1990, 2020, by = 5),
    limits = c(1990, 2026),
    expand = expansion(mult = c(0, 0.05))
  ) +
  scale_y_continuous(
    breaks = seq(-20, 40, by = 10),
    limits = c(-22, 42),
    labels = function(x) paste0(ifelse(x > 0, "+", ""), x, "%")
  ) +
  scale_color_identity() +
  # Labs
  labs(
    title = title_text,
    subtitle = subtitle_text,
    caption = caption_text,
    x = NULL,
    y = "Relative Difference in\nDiabetes Prevalence (Men vs Women)"
  ) +
  # Theme
  theme(
    plot.title = element_text(
      size = rel(1.55),
      family = fonts$title,
      face = "bold",
      color = colors$title,
      margin = margin(t = 5, b = 5)
    ),
    plot.subtitle = element_markdown(
      size = rel(0.9),
      family = fonts$subtitle,
      color = colors$subtitle,
      lineheight = 1.1,
      margin = margin(t = 5, b = 15)
    ),
    plot.caption = element_markdown(
      size = rel(0.55),
      family = fonts$caption,
      color = colors$caption,
      lineheight = 0.65,
      hjust = 0.5,
      halign = 0.5,
      margin = margin(t = 10, b = 5)
    ),
  )
```
#### 7. Save
```{r}
#| label: save
#| warning: false
### |-  plot image ----
save_plot(
  p,
  type = "30daychartchallenge",
  year = 2025,
  day = 24,
  width = 8,
  height = 8
  )
```
#### 8. Session Info
::: {.callout-tip collapse="true"}
##### Expand for Session Info
```{r, echo = FALSE}
#| eval: true
#| warning: false
sessionInfo()
```
:::
#### 9. GitHub Repository
::: {.callout-tip collapse="true"}
##### Expand for GitHub Repo
The complete code for this analysis is available in [`30dcc_2025_24.qmd`](https://github.com/poncest/personal-website/blob/master/data_visualizations/TidyTuesday/2025/30dcc_2025_24.qmd).
For the full repository, [click here](https://github.com/poncest/personal-website/).
:::
#### 10. References
::: {.callout-tip collapse="true"}
##### Expand for References
1. Data Sources:
- World Health Organization, The Global Health Observatory[indicator = Diabetes prevalence, ID 3356](https://www.who.int/data/gho/data/indicators/indicator-details/GHO/prevalence-of-diabetes-age-standardized)
:::
