---
title: "April 20th Fatal Crashes Compared to Yearly Average (1992-2016)"
subtitle: "Difference between April 20th fatalities and the yearly average for each year"
description: "Analyzing 25 years of traffic fatality data (1992-2016) to examine the alleged connection between April 20th ('4/20') and increased fatal car crashes."
author: "Steven Ponce"
date: "2025-04-20"
categories: ["TidyTuesday", "2025"]
tags: [
"fatal crashes", "road safety", "4/20", "traffic fatalities", "data myths", "statistical analysis", "time series", "seasonal patterns", "vehicle accidents", "public health", "holiday effects", "temporal analysis"
]
image: "thumbnails/tt_2025_16.png"
format:
html:
toc: true
toc-depth: 5
code-link: true
code-fold: true
code-tools: true
code-summary: "Show code"
editor_options:
chunk_output_type: inline
execute:
freeze: true
cache: true
error: false
message: false
warning: false
eval: true
# filters:
# - social-share
# share:
# permalink: "https://stevenponce.netlify.app/data_visualizations/TidyTuesday/2025/tt_2025_16.html"
# description: "My visualization of 25 years of traffic data challenges the '4/20 effect' on fatal crashes. Data shows April 20th had fewer crashes than yearly average in 16 of 25 years studied. #DataScience #TidyTuesday"
#
# twitter: true
# linkedin: true
# email: true
# facebook: false
# reddit: false
# stumble: false
# tumblr: false
# mastodon: true
# bsky: true
---
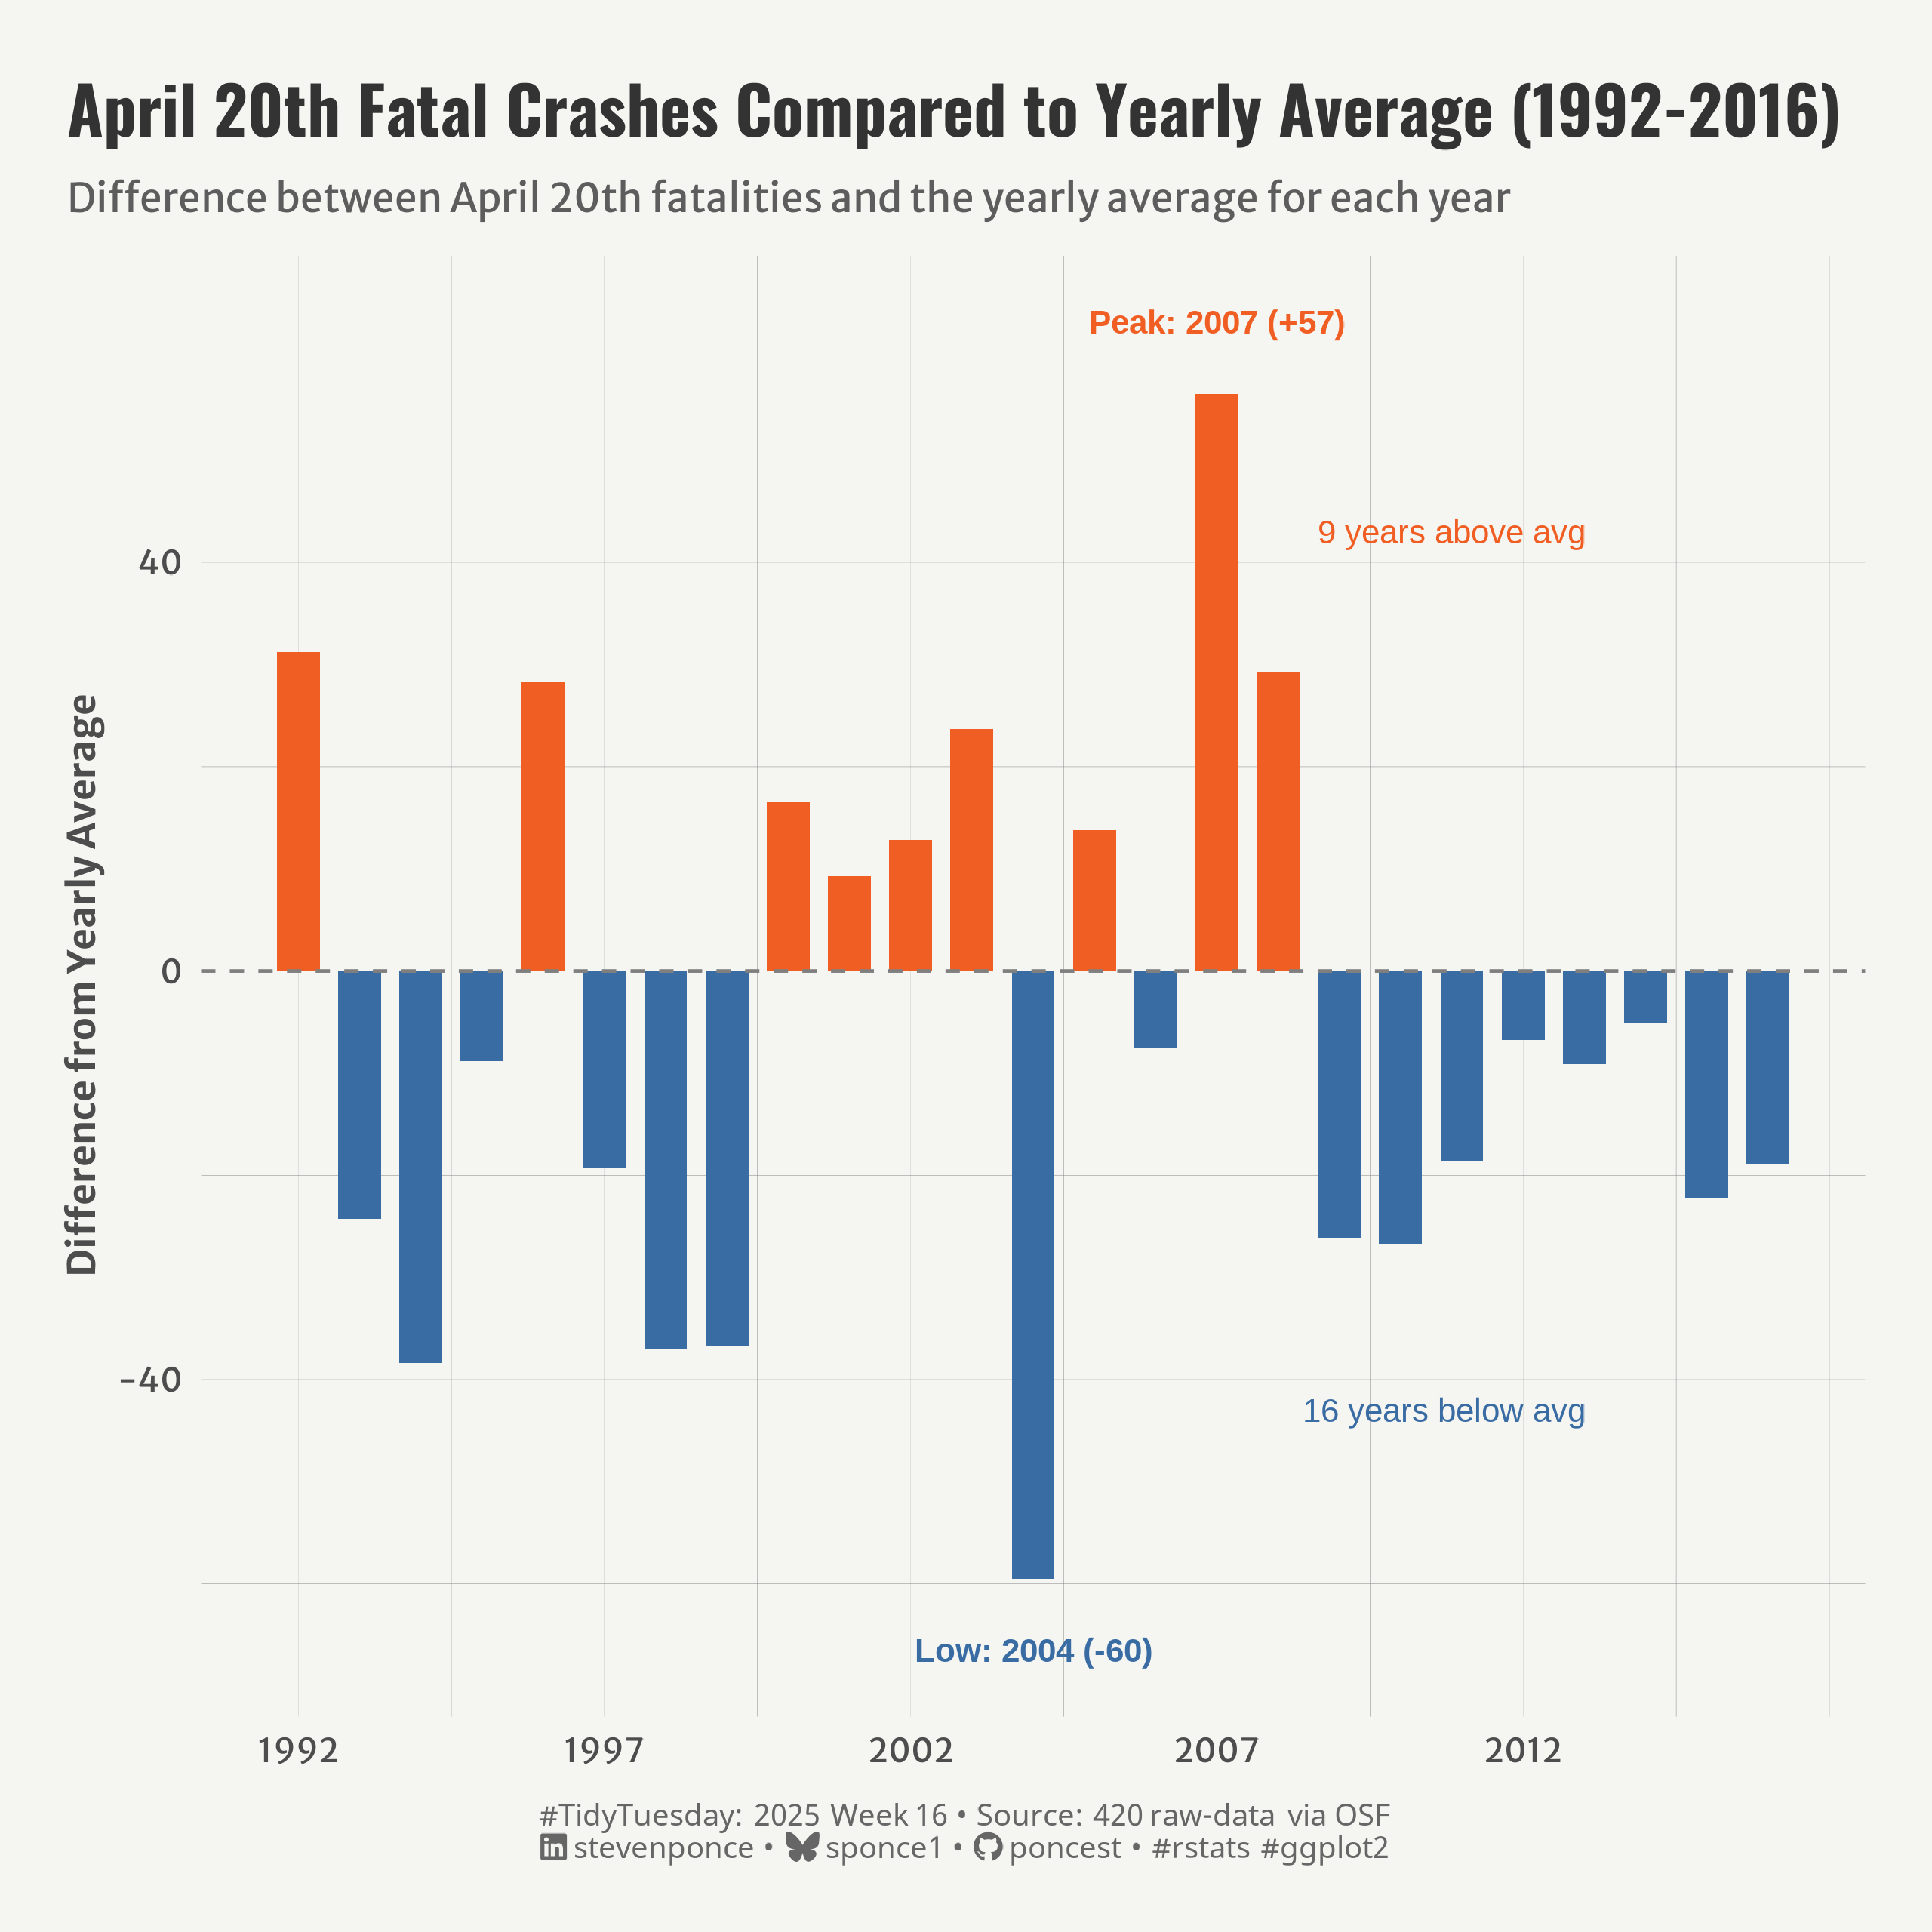{#fig-1}
### <mark> **Steps to Create this Graphic** </mark>
#### 1. Load Packages & Setup
```{r}
#| label: load
#| warning: false
#| message: false
#| results: "hide"
## 1. LOAD PACKAGES & SETUP ----
suppressPackageStartupMessages({
if (!require("pacman")) install.packages("pacman")
pacman::p_load(
     tidyverse,      # Easily Install and Load the 'Tidyverse'
    ggtext,         # Improved Text Rendering Support for 'ggplot2'
    showtext,       # Using Fonts More Easily in R Graphs
    janitor,        # Simple Tools for Examining and Cleaning Dirty Data
    skimr,          # Compact and Flexible Summaries of Data
    scales,         # Scale Functions for Visualization
    glue,           # Interpreted String Literals
    here,           # A Simpler Way to Find Your Files
    camcorder       # Record Your Plot History
    )
})

### |- figure size ----
gg_record(
    dir    = here::here("temp_plots"),
    device = "png",
    width  =  8,
    height =  8,
    units  = "in",
    dpi    = 320
)

# Source utility functions
suppressMessages(source(here::here("R/utils/fonts.R")))
source(here::here("R/utils/social_icons.R"))
source(here::here("R/utils/image_utils.R"))
source(here::here("R/themes/base_theme.R"))
```
#### 2. Read in the Data
```{r}
#| label: read
#| include: true
#| eval: true
#| warning: false
tt <- tidytuesdayR::tt_load(2025, week = 16)

daily_accidents <- tt$daily_accidents |> clean_names()
# daily_accidents_420 <- tt$daily_accidents_420 |> clean_names()

tidytuesdayR::readme(tt)
rm(tt)
```
#### 3. Examine the Data
```{r}
#| label: examine
#| include: true
#| eval: true
#| results: 'hide'
#| warning: false
glimpse(daily_accidents)
skim(daily_accidents)
```
#### 4. Tidy Data
```{r}
#| label: tidy
#| warning: false
### |-  tidy data ----
# Add date components to daily accidents data
daily_accidents_tidy <- daily_accidents |>
    mutate(
        year = year(date),
        month = month(date),
        day = day(date),
        is_april_20 = (month == 4 & day == 20)
    )

# Calculate yearly averages
yearly_averages <- daily_accidents_tidy |>
    group_by(year) |>
    summarize(
        yearly_avg = mean(fatalities_count),
        .groups = "drop"
    )

# Extract April 20th data for each year
april_20_yearly <- daily_accidents_tidy |>
    filter(is_april_20) |>
    select(year, fatalities_count) |>
    arrange(year) |>
    # Join with yearly averages
    left_join(yearly_averages, by = "year") |>
    # Calculate difference from yearly average
    mutate(
        diff_from_avg = fatalities_count - yearly_avg,
        above_avg = diff_from_avg > 0
    )

# Find key statistics for annotations
max_year_data <- april_20_yearly |>
    filter(diff_from_avg == max(diff_from_avg))
max_year <- max_year_data$year
max_diff <- max_year_data$diff_from_avg

min_year_data <- april_20_yearly |>
    filter(diff_from_avg == min(diff_from_avg))
min_year <- min_year_data$year
min_diff <- min_year_data$diff_from_avg

# Count years above and below average
n_above <- sum(april_20_yearly$above_avg)
n_below <- nrow(april_20_yearly) - n_above
```
#### 5. Visualization Parameters
```{r}
#| label: params
#| include: true
#| warning: false
### |-  plot aesthetics ----
colors <- get_theme_colors(
    palette = c(
        "FALSE" = "#3A6CA4", "TRUE" = "#F05E23"
    )
)

### |-  titles and caption ----
title_text <- str_glue("April 20th Fatal Crashes Compared to Yearly Average (1992-2016)")
subtitle_text <- str_glue("Difference between April 20th fatalities and the yearly average for each year")

# Create caption
caption_text <- create_social_caption(
    tt_year = 2025,
    tt_week = 16,
    source_text =  "420 raw-data via OSF"
)

### |-  fonts ----
setup_fonts()
fonts <- get_font_families()

### |-  plot theme ----

# Start with base theme
base_theme <- create_base_theme(colors)

# Add weekly-specific theme elements
weekly_theme <- extend_weekly_theme(
    base_theme,
    theme(
        # Text styling
        plot.title = element_text(face = "bold", family = fonts$title, size = rel(1.14), margin = margin(b = 10)),
        plot.subtitle = element_text(family = fonts$subtitle, color = colors$text, size = rel(0.78), margin = margin(b = 20)),

        # Axis elements
        axis.title = element_text(color = colors$text, face = "bold", size = rel(0.8)),
        axis.text = element_text(color = colors$text, size = rel(0.7)),

        # Grid elements
        panel.grid.minor = element_line(color = "gray50", linewidth = 0.05),
        panel.grid.major = element_line(color = "gray50", linewidth = 0.02),

        # Legend elements
        legend.position = "plot",
        legend.direction = "horizontal",
        legend.title = element_text(family = fonts$text, size = rel(0.8), face = "bold"),
        legend.text = element_text(family = fonts$text, size = rel(0.7)),

        # two-row legend
        legend.box.spacing = unit(0.4, "cm"),
        legend.key.width = unit(1.5, "cm"),
        legend.spacing.x = unit(0.2, "cm"),

        legend.box = "horizontal",
        legend.box.just = "left",

        # Plot margins
        plot.margin = margin(t = 20, r = 20, b = 20, l = 20),
    )
)

# Set theme
theme_set(weekly_theme)
```
#### 6. Plot
```{r}
#| label: plot
#| warning: false
### |-  Plot  ----
p <- ggplot(april_20_yearly, aes(x = year, y = diff_from_avg, fill = above_avg)) +
    # Geoms
    geom_col(width = 0.7) +
    geom_hline(yintercept = 0, linetype = "dashed", color = "gray50", linewidth = 0.5) +
    # Annotate
    annotate(
        "text", x = max_year, y = max_diff + 7,
        label = paste0("Peak: ", max_year, " (+", round(max_diff), ")"),
        color = colors$palette[2], fontface = "bold", size = 3.5
        ) +
    annotate(
        "text", x = min_year, y = min_diff - 7,
        label = paste0("Low: ", min_year, " (", round(min_diff), ")"),
        color = colors$palette[1], fontface = "bold", size = 3.5
        ) +
    annotate(
        "text", x = max(april_20_yearly$year) - 3, y = 43,
        label = paste0(n_above, " years above avg"),
        color = colors$palette[2], size = 3.5, hjust = 1
        ) +
    annotate(
        "text", x = max(april_20_yearly$year) - 3, y = -43,
        label = paste0(n_below, " years below avg"),
        color = colors$palette[1], size = 3.5, hjust = 1
        ) +
    # Scales
    scale_fill_manual(
        values = colors$palette,
        labels = c("Below Average", "Above Average")
    ) +
    scale_x_continuous(
        breaks = seq(
            min(april_20_yearly$year),
            max(april_20_yearly$year),
            by = 5)
        ) +
    # Labs
    labs(
        title = title_text,
        subtitle = subtitle_text,
        caption = caption_text,
        x = NULL,
        y = "Difference from Yearly Average",
    ) +
    # Theme
    theme(
        plot.title = element_text(
            size = rel(1.4),
            family = fonts$title,
            face = "bold",
            color = colors$title,
            lineheight = 1.1,
            margin = margin(t = 5, b = 5)
        ),
        plot.subtitle = element_text(
            size = rel(0.85),
            family = fonts$subtitle,
            color = alpha(colors$subtitle, 0.9),
            lineheight = 1.2,
            margin = margin(t = 5, b = 10)
        ),
        plot.caption = element_markdown(
            size = rel(0.65),
            family = fonts$caption,
            color = colors$caption,
            hjust = 0.5,
            margin = margin(t = 10)
        )
    )
```
#### 7. Save
```{r}
#| label: save
#| warning: false
### |-  plot image ----
save_plot(
  plot = p,
  type = "tidytuesday",
  year = 2025,
  week = 16,
  width = 8,
  height = 8
)
```
#### 8. Session Info
::: {.callout-tip collapse="true"}
##### Expand for Session Info
```{r, echo = FALSE}
#| eval: true
#| warning: false
sessionInfo()
```
:::
#### 9. GitHub Repository
::: {.callout-tip collapse="true"}
##### Expand for GitHub Repo
The complete code for this analysis is available in [`tt_2025_16.qmd`](https://github.com/poncest/personal-website/blob/master/data_visualizations/TidyTuesday/2025/tt_2025_16.qmd).
For the full repository, [click here](https://github.com/poncest/personal-website/).
:::
#### 10. References
::: {.callout-tip collapse="true"}
##### Expand for References
1. Data Sources:
- TidyTuesday 2025 Week 16: [Fatal Car Crashes on 4/20](https://github.com/rfordatascience/tidytuesday/blob/main/data/2025/2025-04-01)
:::
