---
title: "AI Funding Is Not Competitive — It’s Concentrated"
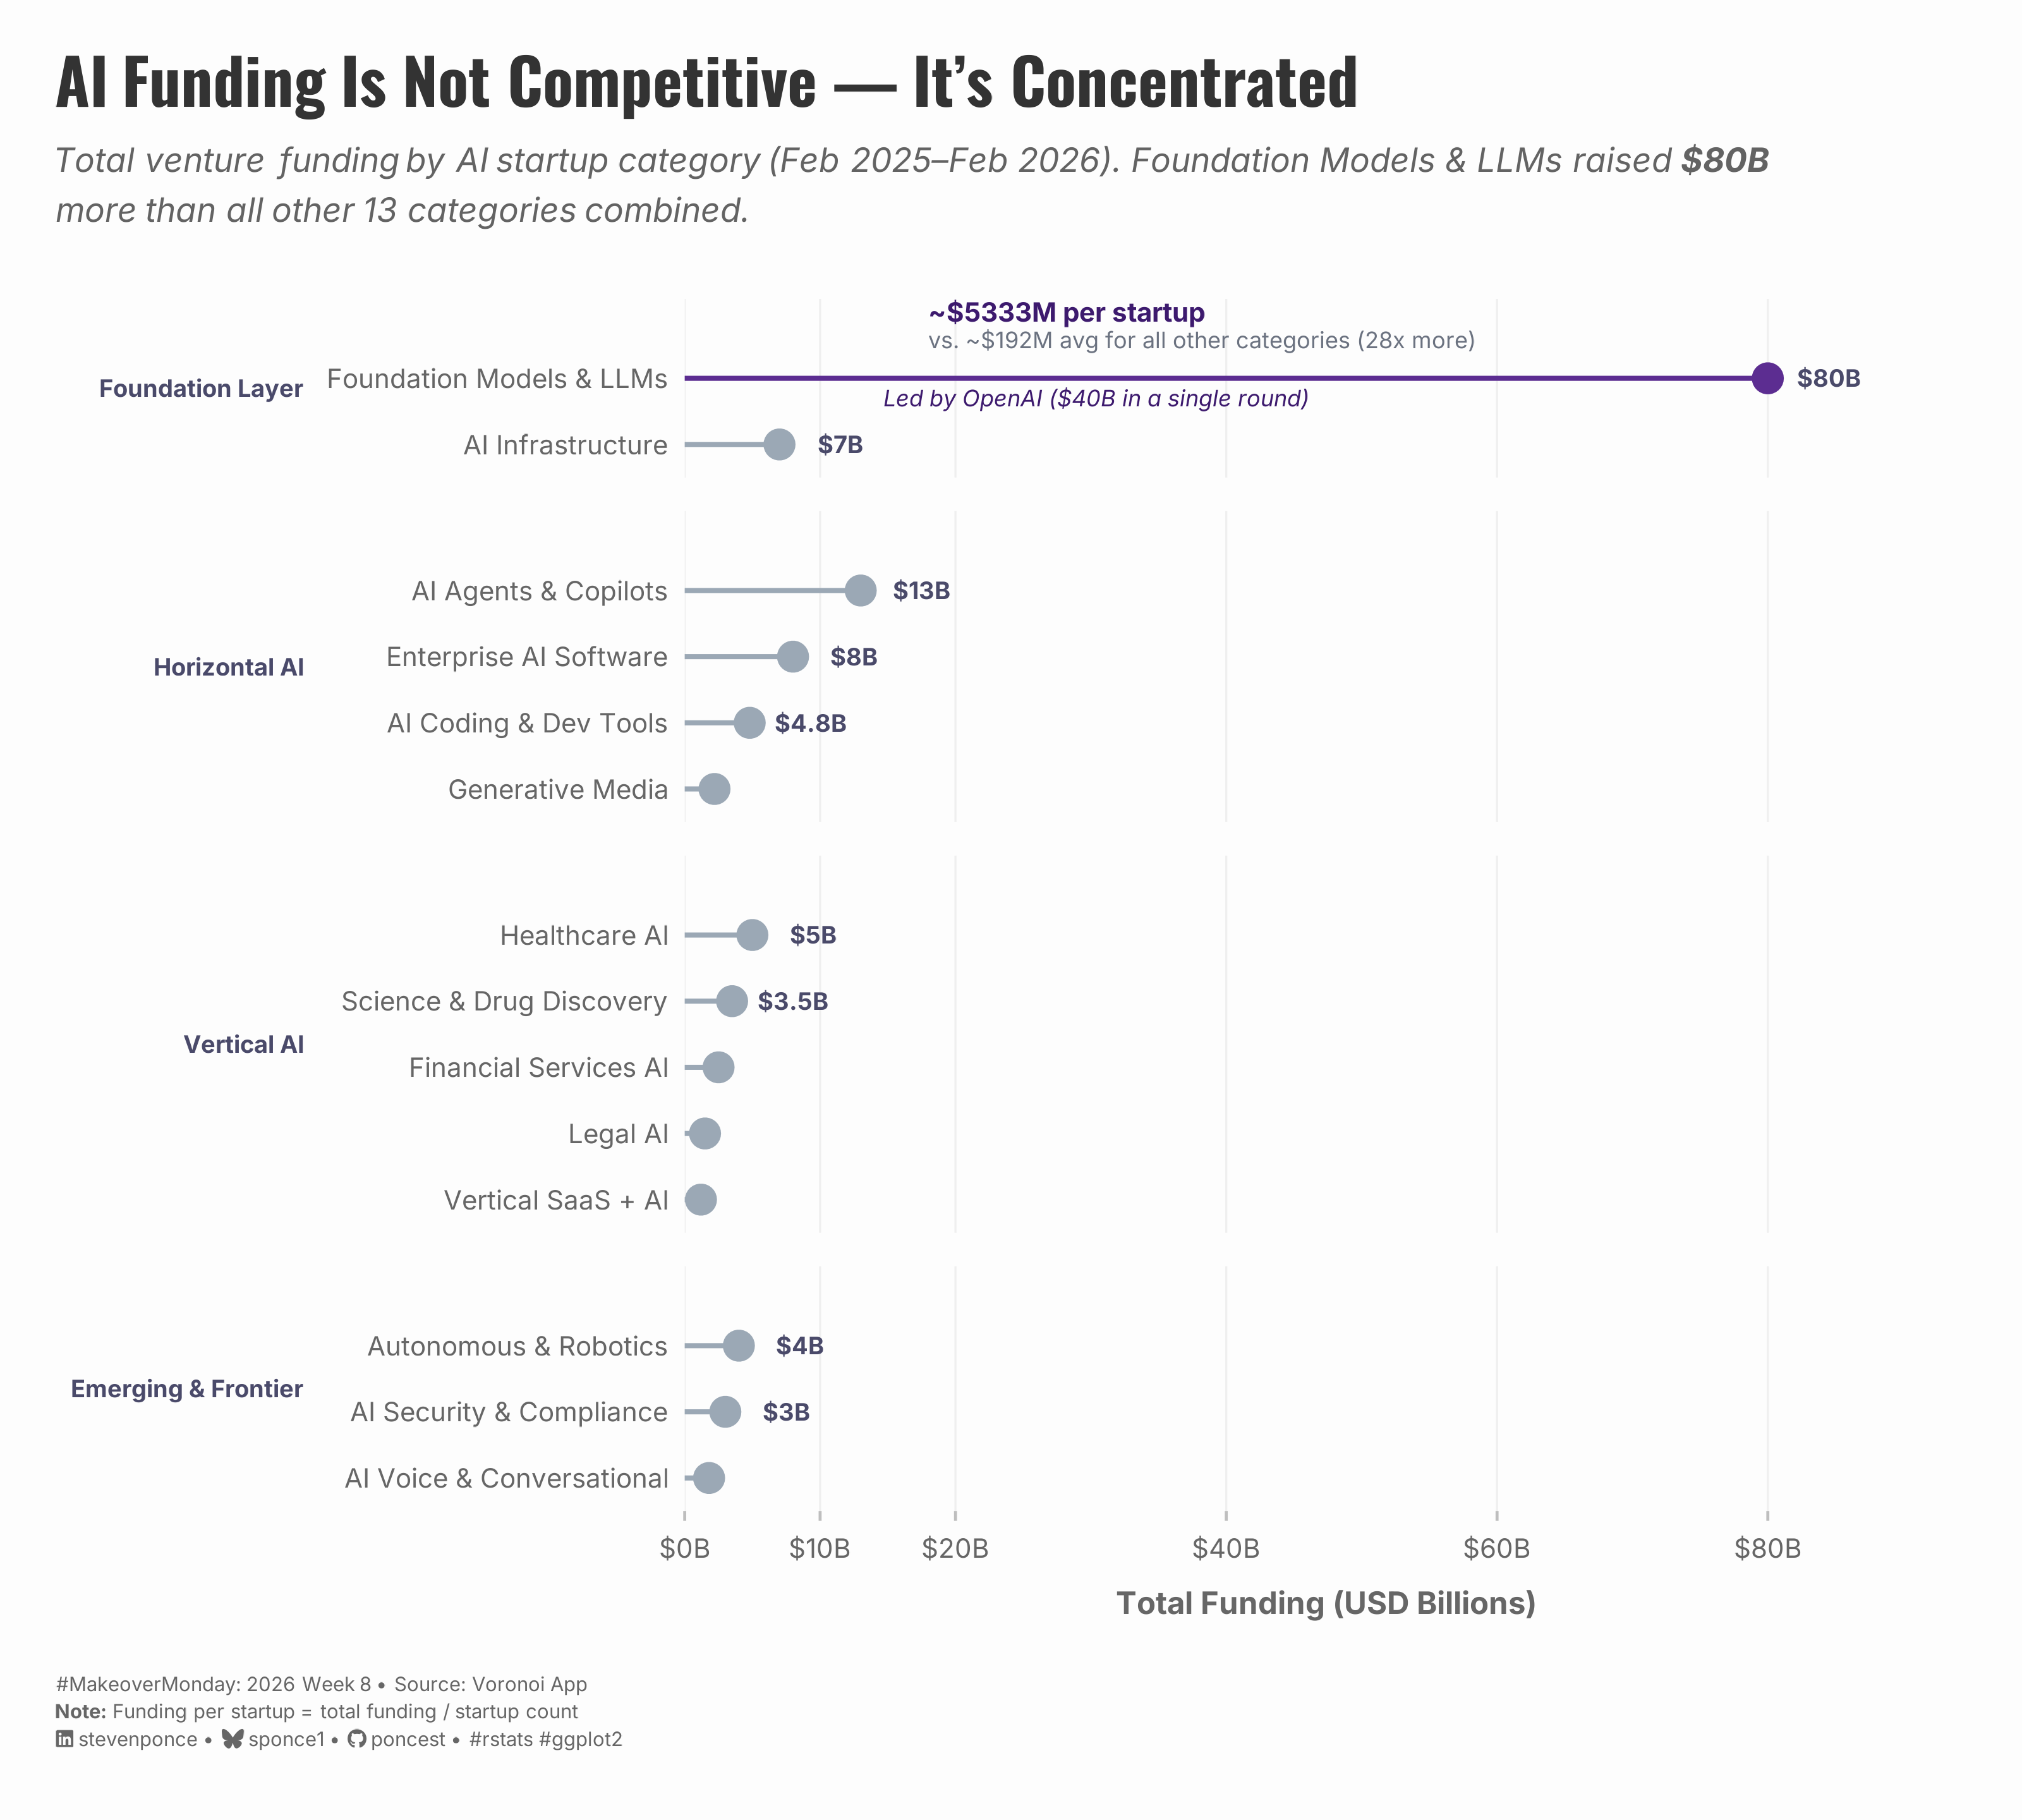
subtitle: "Total venture funding by AI startup category (Feb 2025–Feb 2026). Foundation Models & LLMs raised $80B more than all other 13 categories combined."
description: "Makeover Monday 2026 Week 8. Redesigning the Periodic Table of AI Startups using a grouped lollipop chart to expose extreme funding concentration: Foundation Models & LLMs captured $80B — more than all other 13 categories combined — averaging $5,333M per startup, 28x the average of every other category."
date: "2026-02-16"
author:
- name: "Steven Ponce"
url: "https://stevenponce.netlify.app"
citation:
url: "https://stevenponce.netlify.app/data_visualizations/MakeoverMonday/2026/mm_2026_08.html"
categories: ["MakeoverMonday", "2026"]
tags: [
"makeover-monday",
"data-visualization",
"ggplot2",
"lollipop-chart",
"faceted-plot",
"ai-startups",
"venture-capital",
"funding-analysis",
"2026"
]
image: "thumbnails/mm_2026_08.png"
format:
html:
toc: true
toc-depth: 5
code-link: true
code-fold: true
code-tools: true
code-summary: "Show code"
editor_options:
chunk_output_type: inline
execute:
freeze: true
cache: true
error: false
message: false
warning: false
eval: true
---
```{r}
#| label: setup-links
#| include: false
# CENTRALIZED LINK MANAGEMENT
## Project-specific info
current_year <- 2026
current_week <- 08
project_file <- "mm_2026_08.qmd"
project_image <- "mm_2026_08.png"
## Data Sources
data_main <- "https://data.world/makeovermonday/2026wk-8-the-periodic-table-of-ai-startups"
data_secondary <- "https://data.world/makeovermonday/2026wk-8-the-periodic-table-of-ai-startups"
## Repository Links
repo_main <- "https://github.com/poncest/personal-website/"
repo_file <- paste0("https://github.com/poncest/personal-website/blob/master/data_visualizations/MakeoverMonday/", current_year, "/", project_file)
## External Resources/Images
chart_original <- "https://raw.githubusercontent.com/poncest/MakeoverMonday/refs/heads/master/2026/Week_08/original_chart.png"
## Organization/Platform Links
org_primary <- "https://www.voronoiapp.com/investing/The-Periodic-Table-of-AI-Startups--14-categories-of-AI-companies-foundedfunded-Feb-2025-Feb-2026-7663"
org_secondary <- "https://www.voronoiapp.com/investing/The-Periodic-Table-of-AI-Startups--14-categories-of-AI-companies-foundedfunded-Feb-2025-Feb-2026-7663"
# Helper function to create markdown links
create_link <- function(text, url) {
paste0("[", text, "](", url, ")")
}
# Helper function for citation-style links
create_citation_link <- function(text, url, title = NULL) {
if (is.null(title)) {
paste0("[", text, "](", url, ")")
} else {
paste0("[", text, "](", url, ' "', title, '")')
}
}
```
### Original
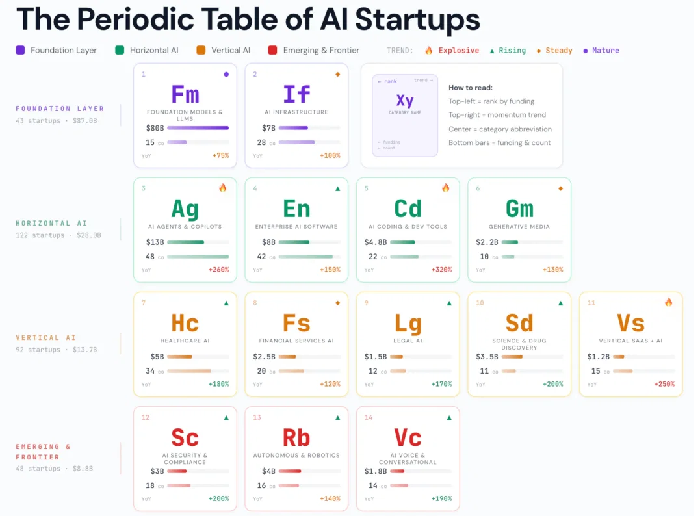
The original visualization comes from `r create_link("Periodic Table of AI", data_secondary)`
### Makeover
{#fig-1}
### [**Steps to Create this Graphic**]{.mark}
#### [1. Load Packages & Setup]{.smallcaps}
```{r}
#| label: load
#| warning: false
#| message: false
#| results: "hide"

## 1. LOAD PACKAGES & SETUP ----
suppressPackageStartupMessages({
  if (!require("pacman")) install.packages("pacman")
  pacman::p_load(
    tidyverse, ggtext, showtext, scales, glue,
  janitor, lubridate
)
})

### |- figure size ----
camcorder::gg_record(
  dir    = here::here("temp_plots"),
  device = "png",
  width  = 10,
  height = 9,
  units  = "in",
  dpi    = 320
)

# Source utility functions
suppressMessages(source(here::here("R/utils/fonts.R")))
source(here::here("R/utils/social_icons.R"))
source(here::here("R/utils/image_utils.R"))
source(here::here("R/themes/base_theme.R"))
```
#### [2. Read in the Data]{.smallcaps}
```{r}
#| label: read
#| include: true
#| eval: true
#| warning: false
#|

df_raw <- readxl::read_excel(
  here::here("data/MakeoverMonday/2026/Periodic Table of AI.xlsx")) |>
  clean_names()
```
#### [3. Examine the Data]{.smallcaps}
```{r}
#| label: examine
#| include: true
#| eval: true
#| results: 'hide'
#| warning: false

glimpse(df_raw)
```
#### [4. Tidy Data]{.smallcaps}
```{r}
#| label: tidy
#| warning: false

### |- Enrich ----
df_enriched <- df_raw |>
  mutate(
    group_label = factor(
      group_label,
      levels = c("Foundation Layer", "Horizontal AI", "Vertical AI", "Emerging & Frontier")
    ),
    is_fm = name == "Foundation Models & LLMs",
    funding_per_startup_m = round(funding_billions * 1000 / startup_count, 0)
  )

### |- Key stats for annotations ----
fm_fps <- df_enriched |>
  filter(is_fm) |>
  pull(funding_per_startup_m)

others_fps <- df_enriched |>
  filter(!is_fm) |>
  summarise(avg = round(mean(funding_per_startup_m), 0)) |>
  pull(avg)

multiplier <- round(fm_fps / others_fps, 0)

### |- Plot data ----
plot_data <- df_enriched |>
  group_by(group_label) |>
  arrange(funding_billions, .by_group = TRUE) |>
  ungroup() |>
  mutate(
    name_within = paste0(name, "___", group_label),
    name_within = fct_inorder(name_within),
    highlight = if_else(is_fm,
                        "Foundation Models & LLMs",
                        "All other categories"
    ),
    funding_label = if_else(
      funding_billions >= 3,
      paste0("$", funding_billions, "B"),
      NA_character_
    )
  )

### |- Annotation data ----
ann_line1 <- tibble(
  group_label = factor("Foundation Layer", levels = levels(plot_data$group_label)),
  x = 18, y_num = 3,
  label = glue("~${fm_fps}M per startup")
)
ann_line2 <- tibble(
  group_label = factor("Foundation Layer", levels = levels(plot_data$group_label)),
  x = 18, y_num = 2.58,
  label = glue("vs. ~${others_fps}M avg for all other categories ({multiplier}x more)")
)
ann_line3 <- tibble(
  group_label = factor("Foundation Layer", levels = levels(plot_data$group_label)),
  x = 46, y_num = 1.70,
  label = "Led by OpenAI ($40B in a single round)"
)
```
#### [5. Visualization Parameters]{.smallcaps}
```{r}
#| label: params
#| include: true
#| warning: false

### |-  plot aesthetics ----
colors <- get_theme_colors(
  palette = list(
    highlight  = "#5C2D91",
    default    = "#9BA8B5",
    annotation = "#3D1A6E",
    note       = "#6B7280",
    grid       = "#EFEFEF",
    text_dark  = "#1A1A2E",
    text_mid   = "#4A4A6A",
    text_light = "#9A9AB0"
  )
)

### |- titles and caption ----
title_text    <- "AI Funding Is Not Competitive \u2014 It\u2019s Concentrated"

subtitle_text <- glue(
  "Total venture funding by AI startup category (Feb 2025\u2013Feb 2026). ",
  "Foundation Models & LLMs raised **$80B**<br>more than all other 13 categories combined."
)

caption_text <- create_mm_caption(
  mm_year     = 2026,
  mm_week     = 8,
  source_text = "Voronoi App<br>**Note:** Funding per startup = total funding / startup count"
)

### |-  fonts ----
setup_fonts()
fonts <- get_font_families()

### |-  plot theme ----

# Start with base theme
base_theme <- create_base_theme(colors)

# Add weekly-specific theme elements
weekly_theme <- extend_weekly_theme(
  base_theme,
  theme(
    # # Text styling
    plot.title = element_text(
      size = rel(1.3), family = fonts$title, face = "bold",
      color = colors$title, lineheight = 1.1, hjust = 0,
      margin = margin(t = 5, b = 10)
    ),
    plot.subtitle = element_markdown(
      size = rel(0.8), family = fonts$subtitle, face = "italic",
      color = alpha(colors$subtitle, 0.9), lineheight = 1.1,
      margin = margin(t = 0, b = 20)
    ),

    # Legend formatting
    legend.position = "plot",
    legend.justification = "right",
    legend.margin = margin(l = 12, b = 5),
    legend.key.size = unit(0.8, "cm"),
    legend.box.margin = margin(b = 10),

    # Axis formatting
    # axis.line.x  = element_line(color = "#252525", linewidth = .1),
    # axis.ticks.y = element_blank(),
    axis.ticks.x = element_line(color = "gray", linewidth = 0.5),
    axis.title.x = element_text(
      face = "bold", size = rel(0.85),
      margin = margin(t = 10), family = fonts$subtitle,
      color = "gray40"
    ),
    axis.title.y = element_text(
      face = "bold", size = rel(0.85),
      margin = margin(r = 10), family = fonts$subtitle,
      color = "gray40"
    ),
    axis.text.x = element_text(
      size = rel(0.85), family = fonts$subtitle,
      color = "gray40"
    ),
    axis.text.y = element_markdown(
      size = rel(0.85), family = fonts$subtitle,
      color = "gray40"
    ),

    # Grid lines
    # panel.grid.minor = element_line(color = "#ecf0f1", linewidth = 0.2),
    # panel.grid.major = element_line(color = "#ecf0f1", linewidth = 0.4),
    panel.grid.major.x = element_line(color = colors$palette$grid, linewidth = 0.35),
    panel.grid.major.y = element_blank(),
    panel.grid.minor   = element_blank(),

    # Margin
    plot.margin = margin(20, 20, 20, 20)
  )
)

# Set theme
theme_set(weekly_theme)
```
#### [6. Plot]{.smallcaps}
```{r}
#| label: plot
#| warning: false

### |- Final Plot ----
p <- ggplot(plot_data, aes(x = funding_billions, y = name_within)) +
  # Geoms
  geom_segment(
    aes(x = 0, xend = funding_billions, yend = name_within, color = highlight),
    linewidth = 0.85,
    show.legend = FALSE
  ) +
  geom_point(
    aes(color = highlight),
    size = 4.5,
    show.legend = FALSE
  ) +
  geom_text(
    aes(label = funding_label),
    nudge_x = 4.5,
    size = 3.0,
    color = colors$palette$text_mid,
    fontface = "bold",
    family = fonts$text,
    na.rm = TRUE
  ) +
  geom_text(
    data = ann_line1,
    aes(x = x, y = y_num, label = label),
    inherit.aes = FALSE,
    color = colors$palette$annotation,
    size = 3.3,
    fontface = "bold",
    hjust = 0,
    family = fonts$text
  ) +
  geom_text(
    data = ann_line2,
    aes(x = x, y = y_num, label = label),
    inherit.aes = FALSE,
    color = colors$palette$note,
    size = 2.85,
    hjust = 0,
    family = fonts$text
  ) +
  geom_text(
    data = ann_line3,
    aes(x = x, y = y_num, label = label),
    inherit.aes = FALSE,
    color = colors$palette$annotation,
    size = 2.85,
    fontface = "italic",
    hjust = 1,
    family = fonts$text
  ) +
  # Facet
  facet_grid(
    group_label ~ .,
    scales = "free_y",
    space  = "free_y",
    switch = "y"
  ) +
  # Scales
  scale_color_manual(
    values = c(
      "Foundation Models & LLMs" = colors$palette$highlight,
      "All other categories"     = colors$palette$default
    )
  ) +
  scale_y_discrete(
    labels = function(x) sub("___.*$", "", x),
    expand = expansion(add = c(0.5, 1.2))
  ) +
  scale_x_continuous(
    labels = label_dollar(suffix = "B", accuracy = 1),
    breaks = c(0, 10, 20, 40, 60, 80),
    expand = expansion(mult = c(0, 0.12))
  ) +
  # Labs
  labs(
    title    = title_text,
    subtitle = subtitle_text,
    x        = "Total Funding (USD Billions)",
    y        = NULL,
    caption  = caption_text
  ) +
  # Theme
  theme(
    # Facet strips — left side, clean
    strip.placement = "outside",
    strip.text.y.left = element_text(
      angle  = 0,
      hjust  = 1,
      face   = "bold",
      size   = 8.5,
      color  = colors$palette$text_mid
    ),
    strip.background = element_blank(),

    # Spacing between facets
    panel.spacing.y = unit(12, "pt"),
    plot.title = element_markdown(
      size = rel(1.6),
      family = fonts$title,
      face = "bold",
      color = colors$title,
      lineheight = 1.15,
      margin = margin(t = 0, b = 5)
    ),
    plot.subtitle = element_markdown(
      size = rel(0.85),
      family = fonts$subtitle,
      face = "italic",
      color = alpha(colors$subtitle, 0.88),
      lineheight = 1.5,
      margin = margin(t = 5, b = 25)
    ),
    plot.caption = element_markdown(
      size = rel(0.5),
      family = fonts$subtitle,
      color = colors$caption,
      hjust = 0,
      lineheight = 1.4,
      margin = margin(t = 20, b = 5)
    )
  )
```
#### [7. Save]{.smallcaps}
```{r}
#| label: save
#| warning: false

### |-  plot image ----
save_plot(
  plot = p,
  type = "makeovermonday",
  year = current_year,
  week = current_week,
  width = 10,
  height = 9
  )
```
#### [8. Session Info]{.smallcaps}
::: {.callout-tip collapse="true"}
##### Expand for Session Info
```{r, echo = FALSE}
#| eval: true
#| warning: false
sessionInfo()
```
:::
#### [9. GitHub Repository]{.smallcaps}
::: {.callout-tip collapse="true"}
##### Expand for GitHub Repo
The complete code for this analysis is available in `r create_link(project_file, repo_file)`.
For the full repository, `r create_link("click here", repo_main)`.
:::
#### [10. References]{.smallcaps}
::: {.callout-tip collapse="true"}
##### Expand for References
**Primary Data (Makeover Monday):**
1. Makeover Monday `r current_year` Week `r current_week`: `r create_link("The Periodic Table of AI Startups", data_main)`
2. Original Article: `r create_link("The Periodic Table of AI Startups — 14 categories of AI companies founded/funded Feb 2025–Feb 2026", "https://www.voronoiapp.com/investing/The-Periodic-Table-of-AI-Startups--14-categories-of-AI-companies-foundedfunded-Feb-2025-Feb-2026-7663")`
- Source: Voronoi App
- Coverage: 14 AI startup categories, February 2025–February 2026
**Source Data:**
3. Dataset: `r create_link("2026 Week 8 — The Periodic Table of AI Startups", "https://data.world/makeovermonday/2026wk-8-the-periodic-table-of-ai-startups")`
- Source: Voronoi App via data.world/makeovermonday
- Data includes: Category name, symbol, group layer, total funding ($B), startup count, YoY growth (%), and trend label
- Categories covered: Foundation Layer, Horizontal AI, Vertical AI, Emerging & Frontier
- Period: February 2025–February 2026
**Note:** One derived metric was computed for this visualization: **funding per startup** (total funding × 1,000 / startup count), expressed in USD millions. No other transformations were applied to the source data.
:::
#### [11. Custom Functions Documentation]{.smallcaps}
::: {.callout-note collapse="true"}
##### 📦 Custom Helper Functions
This analysis uses custom functions from my personal module library for efficiency and consistency across projects.
**Functions Used:**
- **`fonts.R`**: `setup_fonts()`, `get_font_families()` - Font management with showtext
- **`social_icons.R`**: `create_social_caption()` - Generates formatted social media captions
- **`image_utils.R`**: `save_plot()` - Consistent plot saving with naming conventions
- **`base_theme.R`**: `create_base_theme()`, `extend_weekly_theme()`, `get_theme_colors()` - Custom ggplot2 themes
**Why custom functions?**\
These utilities standardize theming, fonts, and output across all my data visualizations. The core analysis (data tidying and visualization logic) uses only standard tidyverse packages.
**Source Code:**\
View all custom functions → [GitHub: R/utils](https://github.com/poncest/personal-website/tree/master/R)
:::

