• Steven Ponce
  • About
  • Data Visualizations
  • Projects
  • Resume
  • Email

On this page

  • Original
  • Makeover
  • Steps to Create this Graphic
    • 1. Load Packages & Setup
    • 2. Read in the Data
    • 3. Examine the Data
    • 4. Tidy Data
    • 5. Visualization Parameters
    • 6. Plot
    • 7. Save
    • 8. Session Info
    • 9. GitHub Repository
    • 10. References
    • 11. Custom Functions Documentation

Nearly half of these children’s books leave female animal characters out entirely

  • Show All Code
  • Hide All Code

  • View Source

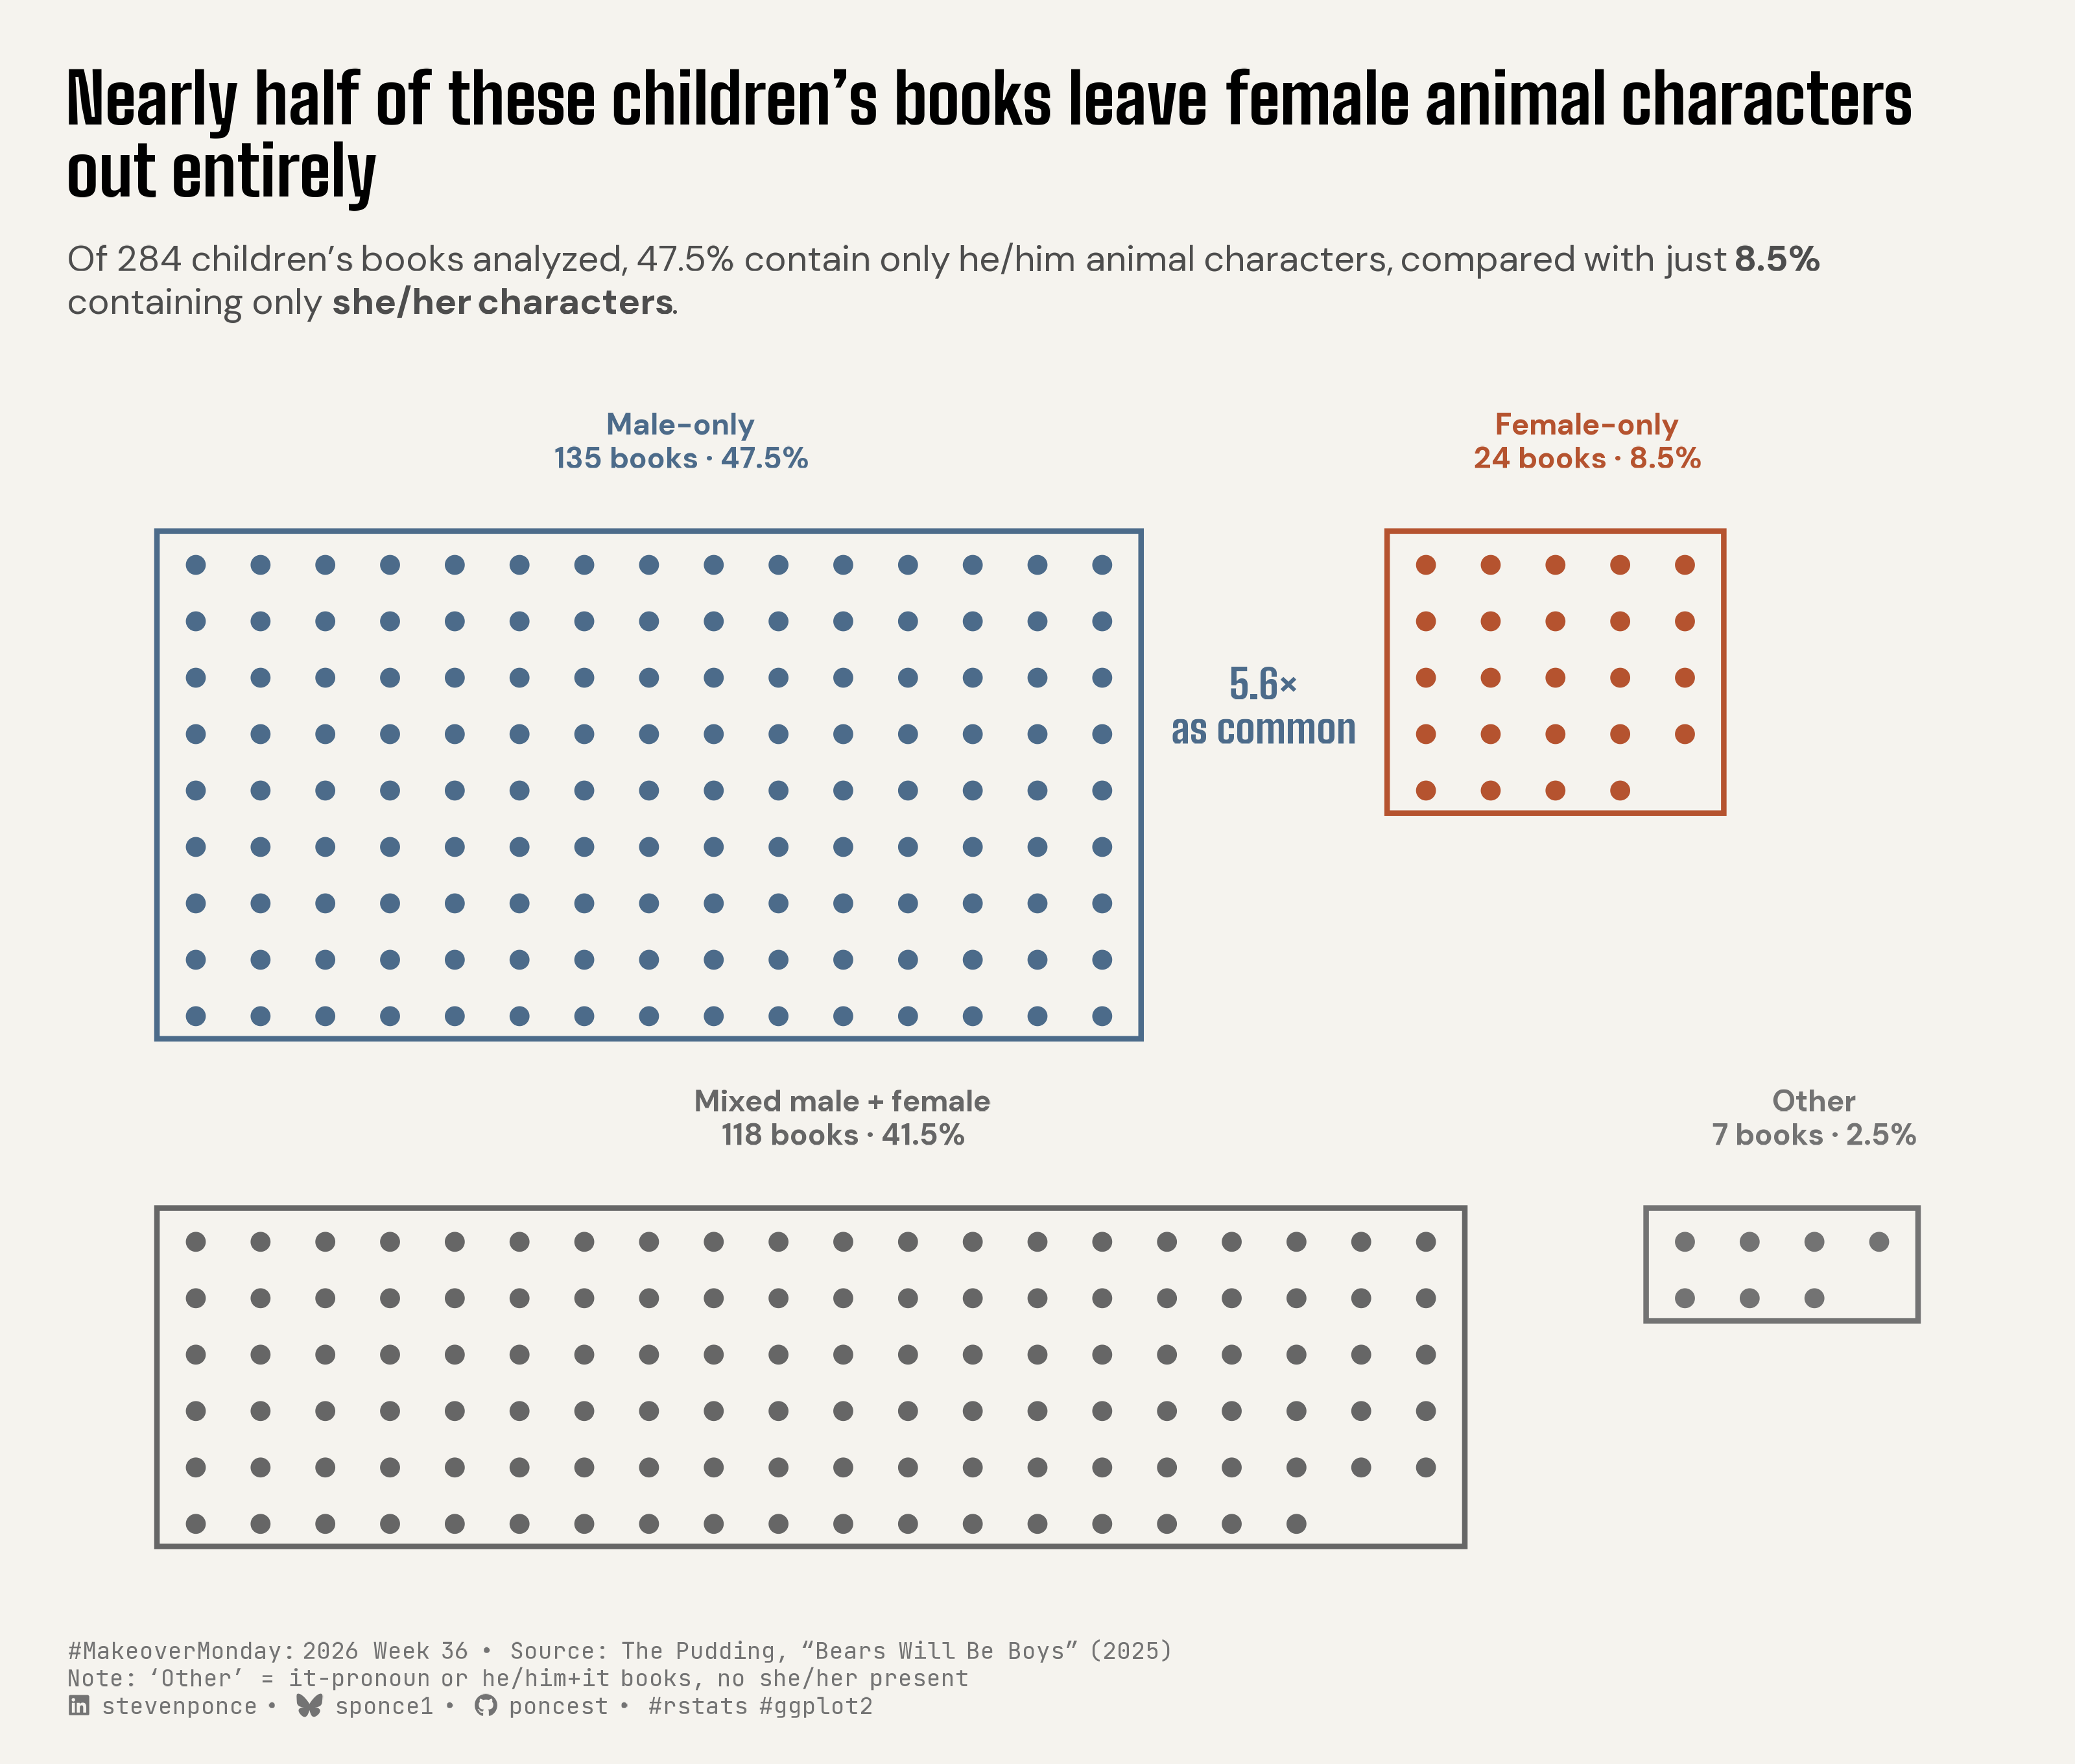
Of 284 children’s books analyzed, 47.5% contain only he/him animal characters, compared with just 8.5% containing only she/her characters.

MakeoverMonday
Data Visualization
R Programming
2026
A book-level analysis of 284 children’s books finds that books excluding female animal characters entirely (47.5%) outnumber those excluding male animal characters entirely (8.5%) by 5.6 times. The redesign reframes the original character-level pictogram as a book-level exclusion question, using a bounded pictogram enclosure where each dot represents one book. Built in R with ggplot2.
Author

Steven Ponce

Published

September 7, 2026

Original

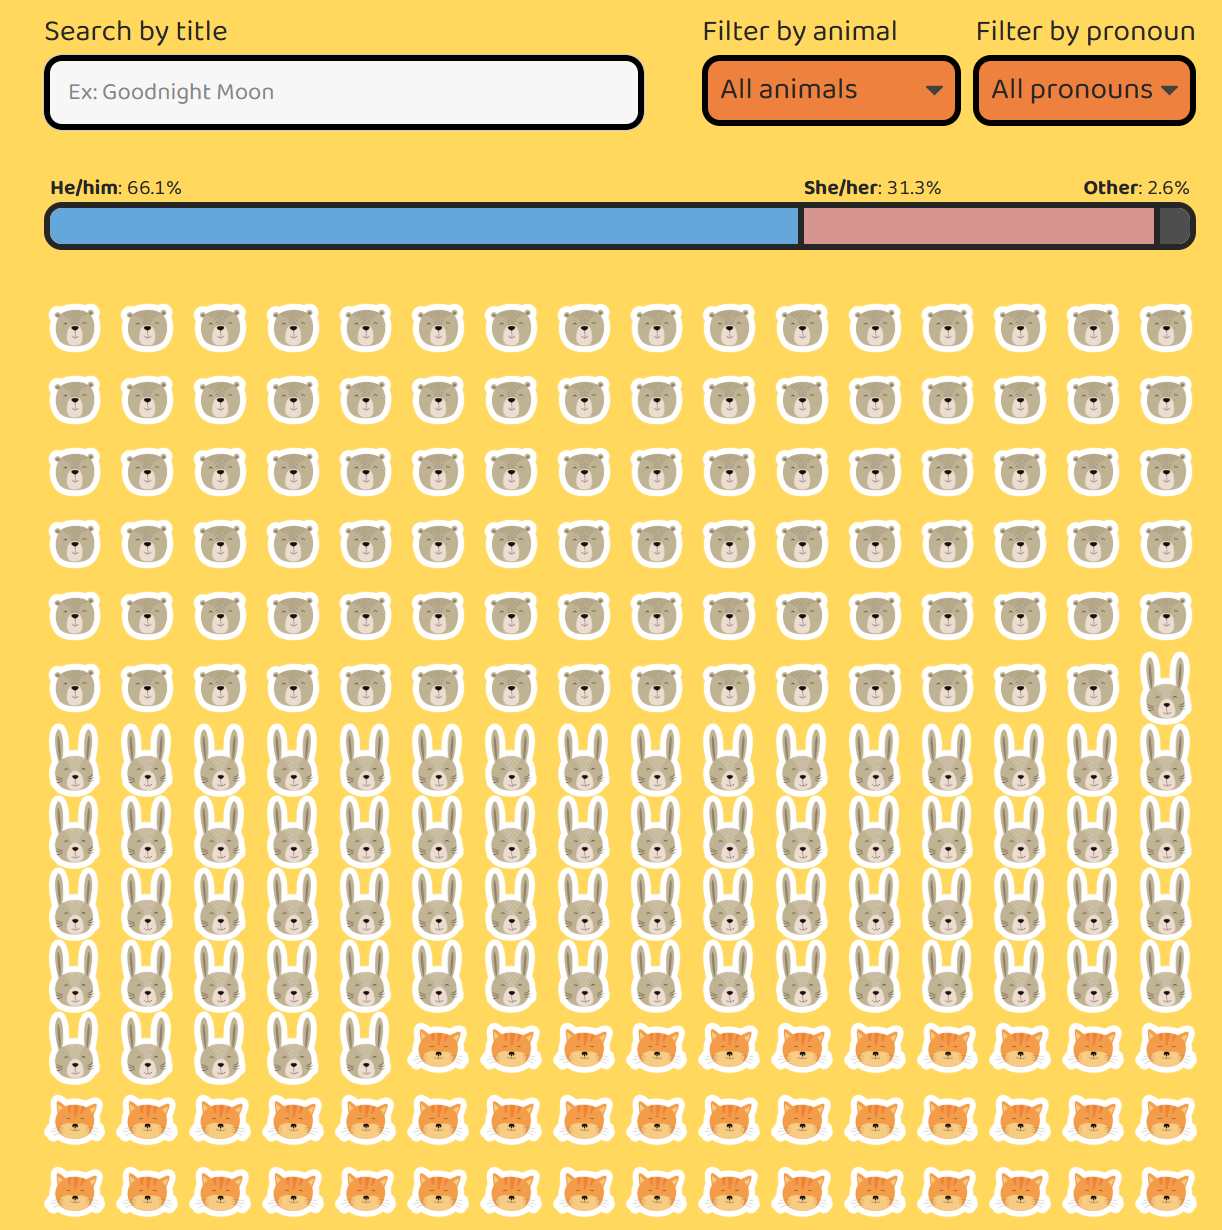
The original visualization comes from Bears Will Be Boys

Original visualization

Makeover

Figure 1: Pictogram chart: 135 of 284 children’s books (47.5%) contain only he/him animal characters, versus just 24 (8.5%) with only she/her characters — 5.6 times as common. 118 books (41.5%) mix both; 7 books (2.5%) contain only it-pronoun characters. Each dot = one book. Source: The Pudding, “Bears Will Be Boys.”

Steps to Create this Graphic

1. Load Packages & Setup

Show code
```{r}
#| label: load
#| warning: false
#| message: false      
#| results: "hide"     

## 1. LOAD PACKAGES & SETUP ----
suppressPackageStartupMessages({
  if (!require("pacman")) install.packages("pacman")
  pacman::p_load(
    tidyverse, ggtext, showtext, scales, glue, 
  janitor, ggview
)
})

# Source utility functions
suppressMessages(
  source(here::here("R/utils/fonts.R")))
  source(here::here("R/utils/social_icons.R"))
  source(here::here("R/themes/base_theme.R"))
```

2. Read in the Data

Show code
```{r}
#| label: read
#| include: true
#| eval: true
#| warning: false
#| 

df_raw <- read_csv(
  here::here("data/MakeoverMonday/2026/kids-book-animals.csv"))  |>
  clean_names()
```

3. Examine the Data

Show code
```{r}
#| label: examine
#| include: true
#| eval: true
#| results: 'hide'
#| warning: false

glimpse(df_raw)
skimr::skim_without_charts(df_raw)
```

4. Tidy Data

Show code
```{r}
#| label: tidy
#| warning: false

### |- book-level composition ----
book_composition_raw <- df_raw |>
  summarise(
    n_male = sum(pronoun == "he/him"),
    n_female = sum(pronoun == "she/her"),
    n_it = sum(pronoun == "it"),
    .by = c(goodreads_link, title, pub_year, decade)
  ) |>
  mutate(
    category = case_when(
      n_male > 0 & n_female == 0 & n_it == 0 ~ "Male-only",
      n_female > 0 & n_male == 0 & n_it == 0 ~ "Female-only",
      n_male > 0 & n_female > 0 ~ "Mixed male + female",
      TRUE ~ "Other"
    )
  )

### |- summary counts for the chart ----
book_composition <- book_composition_raw |>
  count(category, name = "n") |>
  mutate(
    pct = n / sum(n),
    category = fct_relevel(category, "Male-only", "Female-only", "Mixed male + female", "Other")
  ) |>
  arrange(category)

male_only_n <- book_composition$n[book_composition$category == "Male-only"]
female_only_n <- book_composition$n[book_composition$category == "Female-only"]
exclusion_ratio <- male_only_n / female_only_n

### |- icon-grid geometry ----
make_icon_grid <- function(n, ncol) {
  tibble(i = 1:n) |> mutate(col = (i - 1) %% ncol, row = (i - 1) %/% ncol)
}

layout_spec <- tribble(
  ~category, ~ncol, ~x_offset, ~y_offset,
  "Male-only", 15, 0, 0,
  "Female-only", 5, 19, 0,
  "Mixed male + female", 20, 0, -12,
  "Other", 4, 23, -12
)

icon_data <- book_composition |>
  left_join(layout_spec, by = "category") |>
  mutate(grid = map2(n, ncol, make_icon_grid)) |>
  unnest(grid) |>
  mutate(x = col + x_offset, y = -row + y_offset)

frame_data <- icon_data |>
  summarise(
    n_rows = max(row) + 1, ncol = first(ncol),
    x_offset = first(x_offset), y_offset = first(y_offset),
    n = first(n), pct = first(pct),
    .by = category
  ) |>
  mutate(
    xmin = x_offset - 0.6, xmax = x_offset + ncol - 0.4,
    ymin = y_offset - (n_rows - 0.6), ymax = y_offset + 0.6
  )
```

5. Visualization Parameters

Show code
```{r}
#| label: params
#| include: true
#| warning: false

### |- plot aesthetics ----
colors <- get_theme_colors(
  palette = list(
    male_only   = "#4C6B8A",
    female_only = "#B5532F",
    mixed       = "#8C8C8C",
    other       = "#BFBFBF"
  )
)
clrs <- colors$palette

label_color_map <- c(
  "Male-only"           = clrs[["male_only"]],
  "Female-only"         = clrs[["female_only"]],
  "Mixed male + female" = "grey40",
  "Other"               = "grey45"
)

### |- titles and caption ----
title_text <- str_glue("Nearly half of these children's books leave female animal characters out entirely")

subtitle_text <- str_glue(
  "Of 284 children's books analyzed, {percent(book_composition$pct[book_composition$category=='Male-only'], accuracy = 0.1)} ",
  "contain only he/him animal characters, compared with just ",
  "**{percent(book_composition$pct[book_composition$category=='Female-only'], accuracy = 0.1)}** containing only **she/her characters**."
)

caption_text <- create_mm_caption(
  mm_year = 2026, mm_week = 36,
  source_text = "The Pudding, \"Bears Will Be Boys\" (2025)<br>Note: 'Other' = it-pronoun or he/him+it books, no she/her present"
)

annotation_text <- glue("{round(exclusion_ratio, 1)}\u00d7\nas common")

### |- fonts ----
setup_fonts()
fonts <- get_font_families()

### |- plot theme ----
base_theme <- create_base_theme(colors)

weekly_theme <- extend_weekly_theme(
  base_theme,
  theme(
    plot.title.position = "plot",
    plot.title = element_textbox_simple(
      size = 24, face = "bold", family = fonts$title_1,
      width = grid::unit(1, "npc"), lineheight = 1.05,
      margin = margin(b = 10)
    ),
    plot.subtitle = element_textbox_simple(
      size = 12.5, family = fonts$subtitle, color = "grey30",
      width = grid::unit(1, "npc"), margin = margin(t = 2, b = 22)
    ),
    plot.caption = element_textbox_simple(
      size = 8, family = fonts$caption, color = "grey45",
      margin = margin(t = 14)
    ),
    axis.text = element_blank(), axis.title = element_blank(),
    axis.ticks = element_blank(), panel.grid = element_blank(),
    plot.margin = margin(24, 24, 16, 24),
    plot.background  = element_rect(fill = clrs[["background"]], color = NA),
    panel.background = element_rect(fill = clrs[["background"]], color = NA)
  )
)

theme_set(weekly_theme)
```

6. Plot

Show code
```{r}
#| label: plot
#| warning: false

## |- label positions ----
label_data <- frame_data |>
  mutate(
    label = glue("{category}\n{n} books \u00b7 {percent(pct, accuracy = 0.1)}"),
    label_y = ymax + 1.6
  )

### |- ratio annotation, named scalar coordinates ----
male_frame   <- frame_data |> filter(category == "Male-only")
female_frame <- frame_data |> filter(category == "Female-only")

ratio_annotation_x <- (male_frame$xmax + female_frame$xmin) / 2
ratio_annotation_y <- female_frame$ymax - 2.4

### |- plot ----
p <- ggplot() +
  geom_rect(
    data = frame_data,
    aes(xmin = xmin, xmax = xmax, ymin = ymin, ymax = ymax, color = category),
    fill = NA, linewidth = 0.9
  ) +
  geom_point(
    data = icon_data,
    aes(x = x, y = y, color = category),
    size = 2.4
  ) +
  geom_text(
    data = label_data,
    aes(x = x_offset + ncol / 2, y = label_y, label = label, color = category),
    fontface = "bold", size = 3.6, lineheight = 0.95, hjust = 0.5
  ) +
  annotate(
    "text",
    x = ratio_annotation_x, y = ratio_annotation_y,
    label = annotation_text,
    fontface = "bold", size = 5, lineheight = 0.9,
    family = fonts$title_2, color = clrs[["male_only"]],
    hjust = 0.5, vjust = 1
  ) +
  scale_color_manual(values = label_color_map, guide = "none") +
  coord_cartesian(clip = "off") +
  labs(title = title_text, subtitle = subtitle_text, caption = caption_text)
```

7. Save

Show code
```{r}
#| label: save
#| warning: false

### |- save ----
main_path  <- here::here("data_visualizations", "MakeoverMonday", "2026", "mm_2026_36.png")
thumb_path <- here::here("data_visualizations", "MakeoverMonday", "2026", "thumbnails", "mm_2026_36.png")

# Full-size version, for the QMD figure
save_ggplot(
  plot = p,
  file = main_path,
  width = 10,
  height = 8.5,
  units = "in",
  dpi = 320,
  create.dir = TRUE
)

# Reduced-size thumbnail, for the YAML `image:` field
fs::dir_create(dirname(thumb_path))
magick::image_read(main_path) |>
  magick::image_resize("400") |>
  magick::image_write(thumb_path)
```

8. Session Info

TipExpand for Session Info
R version 4.6.1 (2026-06-24)
Platform: aarch64-apple-darwin23
Running under: macOS Tahoe 26.6.2

Matrix products: default
BLAS:   /Library/Frameworks/R.framework/Versions/4.6/Resources/lib/libRblas.0.dylib 
LAPACK: /Library/Frameworks/R.framework/Versions/4.6/Resources/lib/libRlapack.dylib;  LAPACK version 3.12.1

locale:
[1] en_US.UTF-8/en_US.UTF-8/en_US.UTF-8/C/en_US.UTF-8/en_US.UTF-8

time zone: America/New_York
tzcode source: internal

attached base packages:
[1] stats     graphics  grDevices utils     datasets  methods   base     

other attached packages:
 [1] here_1.0.2      ggview_0.2.2    janitor_2.2.1   glue_1.8.1     
 [5] scales_1.4.0    showtext_0.9-8  showtextdb_3.0  sysfonts_0.8.9 
 [9] ggtext_0.1.2    lubridate_1.9.5 forcats_1.0.1   stringr_1.6.0  
[13] dplyr_1.2.1     purrr_1.2.2     readr_2.2.0     tidyr_1.3.2    
[17] tibble_3.3.1    ggplot2_4.0.3   tidyverse_2.0.0 pacman_0.5.1   

loaded via a namespace (and not attached):
 [1] gtable_0.3.6       xfun_0.60          htmlwidgets_1.6.4  tzdb_0.5.0        
 [5] vctrs_0.7.3        tools_4.6.1        generics_0.1.4     curl_7.1.0        
 [9] parallel_4.6.1     pkgconfig_2.0.3    RColorBrewer_1.1-3 skimr_2.2.2       
[13] S7_0.2.2           lifecycle_1.0.5    compiler_4.6.1     farver_2.1.2      
[17] textshaping_1.0.5  repr_1.1.7         codetools_0.2-20   snakecase_0.11.1  
[21] litedown_0.10      htmltools_0.5.9    yaml_2.3.12        pillar_1.11.1     
[25] crayon_1.5.3       magick_2.9.1       commonmark_2.0.0   tidyselect_1.2.1  
[29] digest_0.6.39      stringi_1.8.7      labeling_0.4.3     rprojroot_2.1.1   
[33] fastmap_1.2.0      grid_4.6.1         cli_3.6.6          magrittr_2.0.5    
[37] base64enc_0.1-6    withr_3.0.3        bit64_4.8.2        timechange_0.4.0  
[41] rmarkdown_2.31     bit_4.6.0          otel_0.2.0         ragg_1.5.2        
[45] hms_1.1.4          evaluate_1.0.5     knitr_1.51         markdown_2.0      
[49] rlang_1.3.0        gridtext_0.1.6     Rcpp_1.1.2         xml2_1.6.0        
[53] rstudioapi_0.19.0  vroom_1.7.1        jsonlite_2.0.0     R6_2.6.1          
[57] fs_2.1.0           systemfonts_1.3.2 

9. GitHub Repository

TipExpand for GitHub Repo

The complete code for this analysis is available in mm_2026_36.qmd.

For the full repository, click here.

10. References

TipExpand for References

Primary Data (Makeover Monday): 1. Makeover Monday 2026 Week 36: Bears Will Be Boys - CSV: 846 rows × 17 columns (goodreads_link, title, animal, animal_group, pronoun, num_ratings, avg_ratings, num_reviews, author, pub_year, pub_date, decade, decade_category, book_cover_image, description, isbn, publisher). Character-level data on animal protagonists across children’s books, each row one animal character with its assigned pronoun (he/him, she/her, or it). goodreads_link resolves to 284 distinct books — one more than the 283 unique title values, since “The Three Billy Goats Gruff” appears as two separate editions (1841 and 2022) sharing a title but not an identity; goodreads_link was used as the book-level identifier throughout rather than title. - The original visualization is an interactive character-level pictogram: an aggregate 66.1% he/him vs. 31.3% she/her vs. 2.6% it split, followed by an icon grid sorted by animal type. That framing treats all 846 character rows as independent observations, but they originate from only 284 books (median ~2 characters per book, max 27 in a single title), so a small number of character-dense books can weight the aggregate without that being visible to the reader. This makeover shifts the unit of analysis from character to book, testing whether books are structurally more likely to exclude female characters entirely than male characters. The result: 135 books (47.5%) contain only he/him animal characters versus just 24 books (8.5%) containing only she/her characters — a 5.6× exclusion asymmetry sharper than the character-level split implies — while 118 books (41.5%) contain both, and 7 books (2.5%) contain only it-pronoun characters (or he/him plus it, with no she/her present).

Source Data: 2. The Pudding, 2025, Bears Will Be Boys: A data analysis of animal gender in children’s books 3. Dataset (CSV): kids-book-animals.csv

11. Custom Functions Documentation

Note📦 Custom Helper Functions

This analysis uses custom functions from my personal module library for efficiency and consistency across projects.

Functions Used:

  • fonts.R: setup_fonts(), get_font_families() - Font management with showtext
  • social_icons.R: create_social_caption() - Generates formatted social media captions
  • image_utils.R: save_plot() - Consistent plot saving with naming conventions
  • base_theme.R: create_base_theme(), extend_weekly_theme(), get_theme_colors() - Custom ggplot2 themes

Why custom functions?
These utilities standardize theming, fonts, and output across all my data visualizations. The core analysis (data tidying and visualization logic) uses only standard tidyverse packages.

Source Code:
View all custom functions → GitHub: R/utils

Back to top

Citation

BibTeX citation:
@online{ponce2026,
  author = {Ponce, Steven},
  title = {Nearly Half of These Children’s Books Leave Female Animal
    Characters Out Entirely},
  date = {2026-09-07},
  url = {https://stevenponce.netlify.app/data_visualizations/MakeoverMonday/2026/mm_2026_36.html},
  langid = {en}
}
For attribution, please cite this work as:
Ponce, Steven. 2026. “Nearly Half of These Children’s Books Leave Female Animal Characters Out Entirely.” September 7. https://stevenponce.netlify.app/data_visualizations/MakeoverMonday/2026/mm_2026_36.html.
Source Code
---
title: "Nearly half of these children's books leave female animal characters out entirely"
subtitle: "Of 284 children's books analyzed, 47.5% contain only he/him animal characters, compared with just 8.5% containing only she/her characters."
description: "A book-level analysis of 284 children's books finds that books excluding female animal characters entirely (47.5%) outnumber those excluding male animal characters entirely (8.5%) by 5.6 times. The redesign reframes the original character-level pictogram as a book-level exclusion question, using a bounded pictogram enclosure where each dot represents one book. Built in R with ggplot2."
date: "2026-09-07"
author:
  - name: "Steven Ponce"
    url: "https://stevenponce.netlify.app"
citation:
  url: "https://stevenponce.netlify.app/data_visualizations/MakeoverMonday/2026/mm_2026_36.html"
categories: ["MakeoverMonday", "Data Visualization", "R Programming", "2026"]
tags: [
  "makeover-monday",
  "data-visualization",
  "ggplot2",
  "isotype-chart",
  "pictogram",
  "childrens-books",
  "gender-representation",
  "data-storytelling",
  "rstats",
  "annotation",
  "unit-chart",
  "2026"
]
image: "thumbnails/mm_2026_36.png"
format:
  html:
    toc: true
    toc-depth: 5
    code-link: true
    code-fold: true
    code-tools: true
    code-summary: "Show code"
    self-contained: true
    theme: 
      light: [flatly, assets/styling/custom_styles.scss]
      dark: [darkly, assets/styling/custom_styles_dark.scss]
editor_options: 
  chunk_output_type: inline
execute: 
  freeze: true
  cache: true
  error: false
  message: false
  warning: false
  eval: true
---

```{r}
#| label: setup-links
#| include: false

# CENTRALIZED LINK MANAGEMENT

## Project-specific info 
current_year <- 2026
current_week <- 35
project_file <- "mm_2026_36.qmd"
project_image <- "mm_2026_36.png"

## Data Sources
data_main <- "https://pub-cee805df54de4b6c8f93bee984e3c725.r2.dev/datasets/bears-will-be-boys/kids-book-animals.csv"
data_secondary <- "hhttps://pub-cee805df54de4b6c8f93bee984e3c725.r2.dev/datasets/bears-will-be-boys/kids-book-animals.csv"

## Repository Links  
repo_main <- "https://github.com/poncest/personal-website/"
repo_file <- paste0("https://github.com/poncest/personal-website/blob/master/data_visualizations/MakeoverMonday/", current_year, "/", project_file)

## External Resources/Images
chart_original <- "https://raw.githubusercontent.com/poncest/MakeoverMonday/refs/heads/master/2026/Week_36_original_chart.png"

## Organization/Platform Links
org_primary <- "https://pudding.cool/2025/07/kids-books/"
org_secondary <- "https://pudding.cool/2025/07/kids-books/"

# Helper function to create markdown links
create_link <- function(text, url) {
  paste0("[", text, "](", url, ")")
}

# Helper function for citation-style links
create_citation_link <- function(text, url, title = NULL) {
  if (is.null(title)) {
    paste0("[", text, "](", url, ")")
  } else {
    paste0("[", text, "](", url, ' "', title, '")')
  }
}
```

### Original

The original visualization comes from `r create_link("Bears Will Be Boys", org_primary)`
![Original visualization](https://raw.githubusercontent.com/poncest/MakeoverMonday/refs/heads/master/2026/Week_36/original_chart.png)

### Makeover

![Pictogram chart: 135 of 284 children's books (47.5%) contain only he/him animal characters, versus just 24 (8.5%) with only she/her characters — 5.6 times as common. 118 books (41.5%) mix both; 7 books (2.5%) contain only it-pronoun characters. Each dot = one book. Source: The Pudding, "Bears Will Be Boys."](mm_2026_w36.png){#fig-1}

### [**Steps to Create this Graphic**]{.mark}

#### [1. Load Packages & Setup]{.smallcaps}

```{r}
#| label: load
#| warning: false
#| message: false      
#| results: "hide"     

## 1. LOAD PACKAGES & SETUP ----
suppressPackageStartupMessages({
  if (!require("pacman")) install.packages("pacman")
  pacman::p_load(
    tidyverse, ggtext, showtext, scales, glue, 
  janitor, ggview
)
})

# Source utility functions
suppressMessages(
  source(here::here("R/utils/fonts.R")))
  source(here::here("R/utils/social_icons.R"))
  source(here::here("R/themes/base_theme.R"))
```

#### [2. Read in the Data]{.smallcaps}

```{r}
#| label: read
#| include: true
#| eval: true
#| warning: false
#| 

df_raw <- read_csv(
  here::here("data/MakeoverMonday/2026/kids-book-animals.csv"))  |>
  clean_names()
```

#### [3. Examine the Data]{.smallcaps}

```{r}
#| label: examine
#| include: true
#| eval: true
#| results: 'hide'
#| warning: false

glimpse(df_raw)
skimr::skim_without_charts(df_raw)
```

#### [4. Tidy Data]{.smallcaps}

```{r}
#| label: tidy
#| warning: false

### |- book-level composition ----
book_composition_raw <- df_raw |>
  summarise(
    n_male = sum(pronoun == "he/him"),
    n_female = sum(pronoun == "she/her"),
    n_it = sum(pronoun == "it"),
    .by = c(goodreads_link, title, pub_year, decade)
  ) |>
  mutate(
    category = case_when(
      n_male > 0 & n_female == 0 & n_it == 0 ~ "Male-only",
      n_female > 0 & n_male == 0 & n_it == 0 ~ "Female-only",
      n_male > 0 & n_female > 0 ~ "Mixed male + female",
      TRUE ~ "Other"
    )
  )

### |- summary counts for the chart ----
book_composition <- book_composition_raw |>
  count(category, name = "n") |>
  mutate(
    pct = n / sum(n),
    category = fct_relevel(category, "Male-only", "Female-only", "Mixed male + female", "Other")
  ) |>
  arrange(category)

male_only_n <- book_composition$n[book_composition$category == "Male-only"]
female_only_n <- book_composition$n[book_composition$category == "Female-only"]
exclusion_ratio <- male_only_n / female_only_n

### |- icon-grid geometry ----
make_icon_grid <- function(n, ncol) {
  tibble(i = 1:n) |> mutate(col = (i - 1) %% ncol, row = (i - 1) %/% ncol)
}

layout_spec <- tribble(
  ~category, ~ncol, ~x_offset, ~y_offset,
  "Male-only", 15, 0, 0,
  "Female-only", 5, 19, 0,
  "Mixed male + female", 20, 0, -12,
  "Other", 4, 23, -12
)

icon_data <- book_composition |>
  left_join(layout_spec, by = "category") |>
  mutate(grid = map2(n, ncol, make_icon_grid)) |>
  unnest(grid) |>
  mutate(x = col + x_offset, y = -row + y_offset)

frame_data <- icon_data |>
  summarise(
    n_rows = max(row) + 1, ncol = first(ncol),
    x_offset = first(x_offset), y_offset = first(y_offset),
    n = first(n), pct = first(pct),
    .by = category
  ) |>
  mutate(
    xmin = x_offset - 0.6, xmax = x_offset + ncol - 0.4,
    ymin = y_offset - (n_rows - 0.6), ymax = y_offset + 0.6
  )
```

#### [5. Visualization Parameters]{.smallcaps}

```{r}
#| label: params
#| include: true
#| warning: false

### |- plot aesthetics ----
colors <- get_theme_colors(
  palette = list(
    male_only   = "#4C6B8A",
    female_only = "#B5532F",
    mixed       = "#8C8C8C",
    other       = "#BFBFBF"
  )
)
clrs <- colors$palette

label_color_map <- c(
  "Male-only"           = clrs[["male_only"]],
  "Female-only"         = clrs[["female_only"]],
  "Mixed male + female" = "grey40",
  "Other"               = "grey45"
)

### |- titles and caption ----
title_text <- str_glue("Nearly half of these children's books leave female animal characters out entirely")

subtitle_text <- str_glue(
  "Of 284 children's books analyzed, {percent(book_composition$pct[book_composition$category=='Male-only'], accuracy = 0.1)} ",
  "contain only he/him animal characters, compared with just ",
  "**{percent(book_composition$pct[book_composition$category=='Female-only'], accuracy = 0.1)}** containing only **she/her characters**."
)

caption_text <- create_mm_caption(
  mm_year = 2026, mm_week = 36,
  source_text = "The Pudding, \"Bears Will Be Boys\" (2025)<br>Note: 'Other' = it-pronoun or he/him+it books, no she/her present"
)

annotation_text <- glue("{round(exclusion_ratio, 1)}\u00d7\nas common")

### |- fonts ----
setup_fonts()
fonts <- get_font_families()

### |- plot theme ----
base_theme <- create_base_theme(colors)

weekly_theme <- extend_weekly_theme(
  base_theme,
  theme(
    plot.title.position = "plot",
    plot.title = element_textbox_simple(
      size = 24, face = "bold", family = fonts$title_1,
      width = grid::unit(1, "npc"), lineheight = 1.05,
      margin = margin(b = 10)
    ),
    plot.subtitle = element_textbox_simple(
      size = 12.5, family = fonts$subtitle, color = "grey30",
      width = grid::unit(1, "npc"), margin = margin(t = 2, b = 22)
    ),
    plot.caption = element_textbox_simple(
      size = 8, family = fonts$caption, color = "grey45",
      margin = margin(t = 14)
    ),
    axis.text = element_blank(), axis.title = element_blank(),
    axis.ticks = element_blank(), panel.grid = element_blank(),
    plot.margin = margin(24, 24, 16, 24),
    plot.background  = element_rect(fill = clrs[["background"]], color = NA),
    panel.background = element_rect(fill = clrs[["background"]], color = NA)
  )
)

theme_set(weekly_theme)
```

#### [6. Plot]{.smallcaps}

```{r}
#| label: plot
#| warning: false

## |- label positions ----
label_data <- frame_data |>
  mutate(
    label = glue("{category}\n{n} books \u00b7 {percent(pct, accuracy = 0.1)}"),
    label_y = ymax + 1.6
  )

### |- ratio annotation, named scalar coordinates ----
male_frame   <- frame_data |> filter(category == "Male-only")
female_frame <- frame_data |> filter(category == "Female-only")

ratio_annotation_x <- (male_frame$xmax + female_frame$xmin) / 2
ratio_annotation_y <- female_frame$ymax - 2.4

### |- plot ----
p <- ggplot() +
  geom_rect(
    data = frame_data,
    aes(xmin = xmin, xmax = xmax, ymin = ymin, ymax = ymax, color = category),
    fill = NA, linewidth = 0.9
  ) +
  geom_point(
    data = icon_data,
    aes(x = x, y = y, color = category),
    size = 2.4
  ) +
  geom_text(
    data = label_data,
    aes(x = x_offset + ncol / 2, y = label_y, label = label, color = category),
    fontface = "bold", size = 3.6, lineheight = 0.95, hjust = 0.5
  ) +
  annotate(
    "text",
    x = ratio_annotation_x, y = ratio_annotation_y,
    label = annotation_text,
    fontface = "bold", size = 5, lineheight = 0.9,
    family = fonts$title_2, color = clrs[["male_only"]],
    hjust = 0.5, vjust = 1
  ) +
  scale_color_manual(values = label_color_map, guide = "none") +
  coord_cartesian(clip = "off") +
  labs(title = title_text, subtitle = subtitle_text, caption = caption_text)
```

#### [7. Save]{.smallcaps}

```{r}
#| label: save
#| warning: false

### |- save ----
main_path  <- here::here("data_visualizations", "MakeoverMonday", "2026", "mm_2026_36.png")
thumb_path <- here::here("data_visualizations", "MakeoverMonday", "2026", "thumbnails", "mm_2026_36.png")

# Full-size version, for the QMD figure
save_ggplot(
  plot = p,
  file = main_path,
  width = 10,
  height = 8.5,
  units = "in",
  dpi = 320,
  create.dir = TRUE
)

# Reduced-size thumbnail, for the YAML `image:` field
fs::dir_create(dirname(thumb_path))
magick::image_read(main_path) |>
  magick::image_resize("400") |>
  magick::image_write(thumb_path)
```

#### [8. Session Info]{.smallcaps}

::: {.callout-tip collapse="true"}
##### Expand for Session Info

```{r, echo = FALSE}
#| eval: true
#| warning: false

sessionInfo()
```
:::

#### [9. GitHub Repository]{.smallcaps}

::: {.callout-tip collapse="true"}
##### Expand for GitHub Repo

The complete code for this analysis is available in `r create_link(project_file, repo_file)`.

For the full repository, `r create_link("click here", repo_main)`.
:::

#### [10. References]{.smallcaps}
::: {.callout-tip collapse="true"}
##### Expand for References

**Primary Data (Makeover Monday):**
1. Makeover Monday 2026 Week 36: `r create_link("Bears Will Be Boys", "https://pudding.cool/2025/07/kids-books/")`
   - CSV: 846 rows × 17 columns (`goodreads_link`, `title`, `animal`, `animal_group`, `pronoun`, `num_ratings`, `avg_ratings`, `num_reviews`, `author`, `pub_year`, `pub_date`, `decade`, `decade_category`, `book_cover_image`, `description`, `isbn`, `publisher`). Character-level data on animal protagonists across children's books, each row one animal character with its assigned pronoun (`he/him`, `she/her`, or `it`). `goodreads_link` resolves to 284 distinct books — one more than the 283 unique `title` values, since "The Three Billy Goats Gruff" appears as two separate editions (1841 and 2022) sharing a title but not an identity; `goodreads_link` was used as the book-level identifier throughout rather than `title`.
   - The original visualization is an interactive character-level pictogram: an aggregate 66.1% he/him vs. 31.3% she/her vs. 2.6% it split, followed by an icon grid sorted by animal type. That framing treats all 846 character rows as independent observations, but they originate from only 284 books (median ~2 characters per book, max 27 in a single title), so a small number of character-dense books can weight the aggregate without that being visible to the reader. This makeover shifts the unit of analysis from character to book, testing whether books are structurally more likely to exclude female characters entirely than male characters. The result: 135 books (47.5%) contain only he/him animal characters versus just 24 books (8.5%) containing only she/her characters — a 5.6× exclusion asymmetry sharper than the character-level split implies — while 118 books (41.5%) contain both, and 7 books (2.5%) contain only it-pronoun characters (or he/him plus it, with no she/her present).

**Source Data:**
2. The Pudding, 2025, `r create_link("Bears Will Be Boys: A data analysis of animal gender in children's books", "https://pudding.cool/2025/07/kids-books/")`
3. Dataset (CSV): `r create_link("kids-book-animals.csv", "https://pub-cee805df54de4b6c8f93bee984e3c725.r2.dev/datasets/bears-will-be-boys/kids-book-animals.csv")`
:::

#### [11. Custom Functions Documentation]{.smallcaps}

::: {.callout-note collapse="true"}
##### 📦 Custom Helper Functions

This analysis uses custom functions from my personal module library for efficiency and consistency across projects.

**Functions Used:**

-   **`fonts.R`**: `setup_fonts()`, `get_font_families()` - Font management with showtext
-   **`social_icons.R`**: `create_social_caption()` - Generates formatted social media captions
-   **`image_utils.R`**: `save_plot()` - Consistent plot saving with naming conventions
-   **`base_theme.R`**: `create_base_theme()`, `extend_weekly_theme()`, `get_theme_colors()` - Custom ggplot2 themes

**Why custom functions?**\
These utilities standardize theming, fonts, and output across all my data visualizations. The core analysis (data tidying and visualization logic) uses only standard tidyverse packages.

**Source Code:**\
View all custom functions → [GitHub: R/utils](https://github.com/poncest/personal-website/tree/master/R)
:::

© 2024 Steven Ponce

Source Issues
