---
title: "The Competitive Clock"
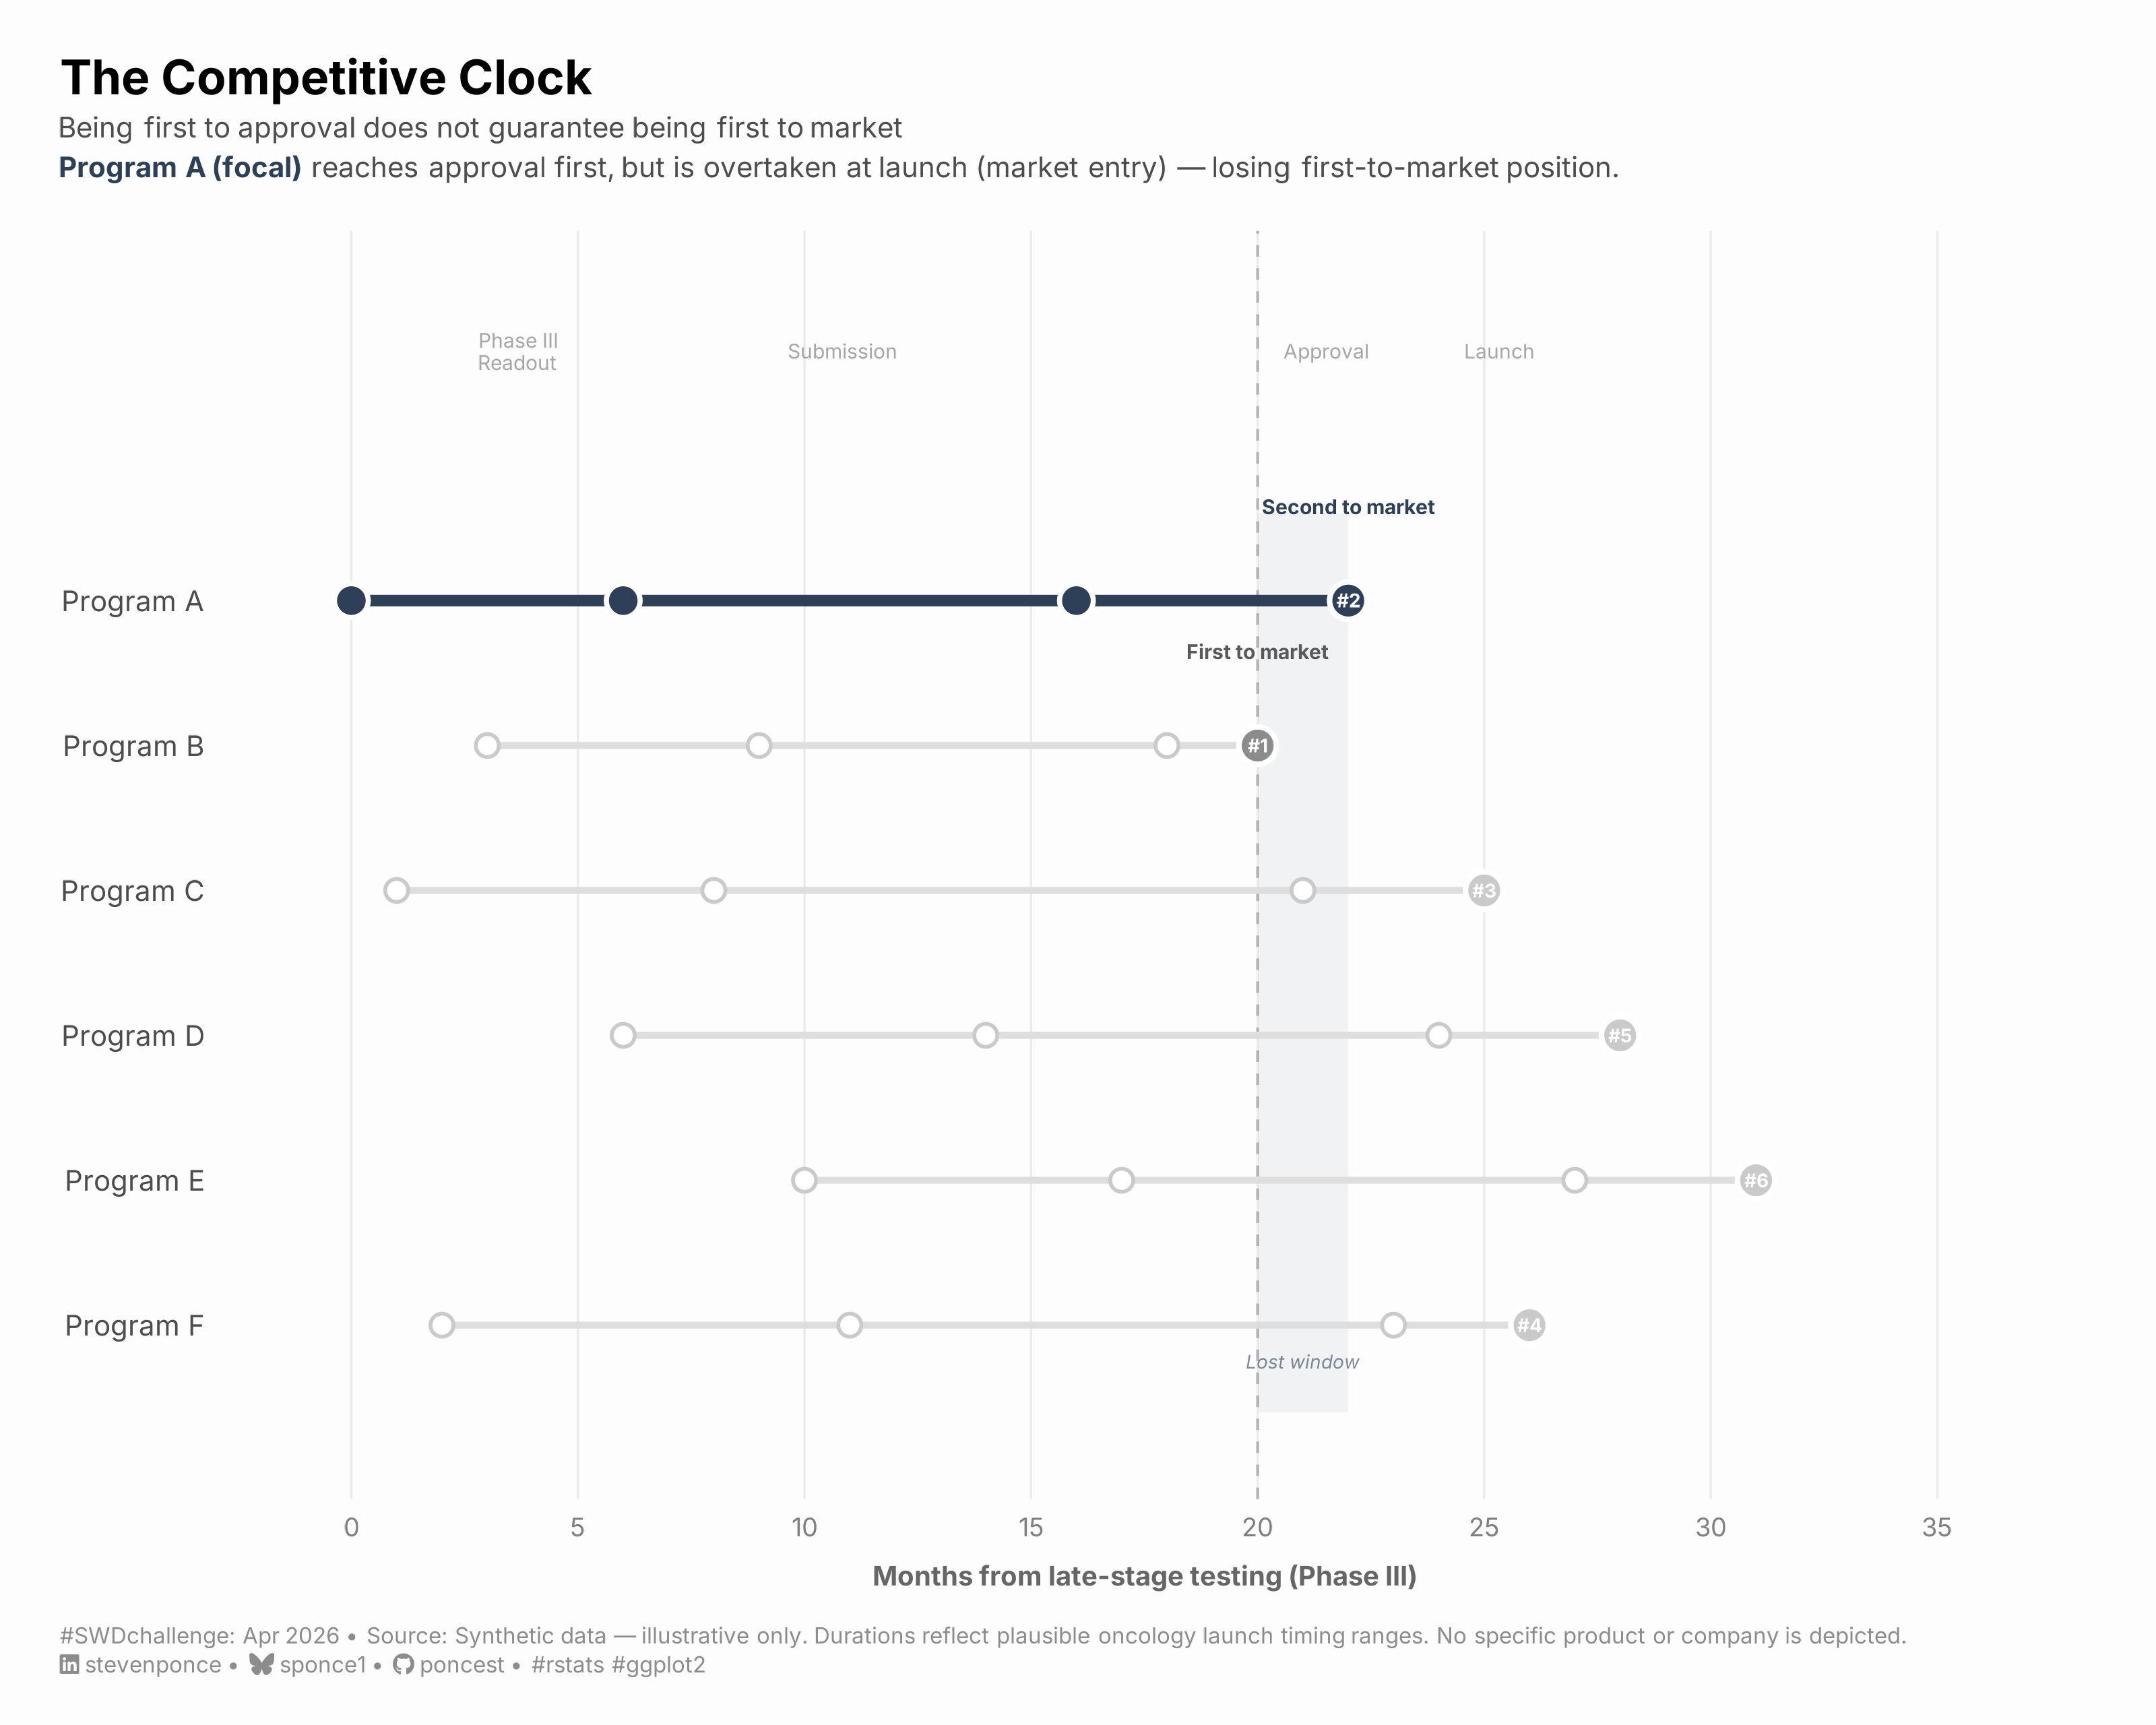
subtitle: "Being first to approval does not guarantee being first to market. Program A (focal) reaches approval first, but is overtaken at launch (market entry) — losing first-to-market position."
description: "A synthetic milestone timeline tracking six oncology programs across four stages — Phase III readout, submission, approval, and launch. Uses competitive ranking and a shaded loss window to show that regulatory speed and commercial leadership follow different clocks."
date: "2026-04-01"
author:
- name: "Steven Ponce"
url: "https://stevenponce.netlify.app"
citation:
url: "https://stevenponce.netlify.app/data_visualizations/SWD%20Challenge/2026/swd_2026_04.html"
categories: ["SWDchallenge", "2026"]
tags: [
"milestone-timeline",
"comparative-timeline",
"competitive-analysis",
"oncology",
"synthetic-data",
"ggplot2",
"annotations",
"dot-plot"
]
image: "thumbnails/swd_2026_04.png"
format:
html:
toc: true
toc-depth: 5
code-link: true
code-fold: true
code-tools: true
code-summary: "Show code"
editor_options:
chunk_output_type: inline
execute:
freeze: true
cache: true
error: false
message: false
warning: false
eval: true
---
### Challenge
This month’s challenge asks you to create a visual that tells a story with time as the organizing structure to help your audience understand what happened, when it happened, and why it matters
Additional information can be found [HERE](https://community.storytellingwithdata.com/challenges/apr-2026-visualize-a-timeline)
### Visualization
{#fig-1}
### [**Steps to Create this Graphic**]{.mark}
#### [1. Load Packages & Setup]{.smallcaps}
```{r}
#| label: load

if (!require("pacman")) install.packages("pacman")
pacman::p_load(
  tidyverse, ggtext, showtext, janitor,
  scales, glue
)

### |- figure size ----
camcorder::gg_record(
  dir    = here::here("temp_plots"),
  device = "png",
  width  = 10,
  height = 8,
  units  = "in",
  dpi    = 320
)

# Source utility functions
suppressMessages(source(here::here("R/utils/fonts.R")))
source(here::here("R/utils/social_icons.R"))
source(here::here("R/utils/image_utils.R"))
source(here::here("R/themes/base_theme.R"))
```
#### [2. Read in the Data]{.smallcaps}
```{r}
#| label: read

### |-  Synthetic oncology launch timelines ----
# Data are illustrative and constructed to represent plausible
# industry timing patterns. No real products or companies are depicted.

# Four milestones per program (months from start of observation window):
#   ph3_end   = Phase III primary endpoint readout
#   submit    = Regulatory submission (NDA/BLA)
#   approval  = Regulatory approval
#   launch    = Commercial launch (first sales)

raw_data <- tribble(
  ~program,    ~type,        ~ph3_end, ~submit, ~approval, ~launch,
  "Program A", "focal",      0,        6,       16,        22,
  "Program B", "competitor", 3,        9,       18,        20,
  "Program C", "competitor", 1,        8,       21,        25,
  "Program D", "competitor", 6,        14,      24,        28,
  "Program E", "competitor", 10,       17,      27,        31,
  "Program F", "competitor", 2,        11,      23,        26
) |>
  # Rank by launch month — this becomes the "competitive outcome" variable
  mutate(launch_rank = rank(launch, ties.method = "first"))
```
#### [3. Examine the Data]{.smallcaps}
```{r}
#| label: examine
#| include: true
#| eval: true
#| results: 'hide'
#| warning: false

glimpse(raw_data)
```
#### [4. Tidy Data]{.smallcaps}
```{r}
#| label: tidy
#| output: false

### |-  Pivot to long for milestone plotting ----
timeline_long <- raw_data |>
  pivot_longer(
    cols      = c(ph3_end, submit, approval, launch),
    names_to  = "milestone",
    values_to = "month"
  ) |>
  mutate(
    milestone = factor(
      milestone,
      levels = c("ph3_end", "submit", "approval", "launch"),
      labels = c("Phase III\nReadout", "Submission", "Approval", "Launch")
    ),
    program = factor(program, levels = rev(c(
      "Program A", "Program B",
      "Program C", "Program D",
      "Program E", "Program F"
    )))
  )

### |-  Launch-only data for outcome encoding ----
launch_only <- raw_data |>
  mutate(
    program = factor(program, levels = rev(c(
      "Program A", "Program B",
      "Program C", "Program D",
      "Program E", "Program F"
    ))),
    launch_color = case_when(
      type == "focal" ~ "#2E4057",
      launch_rank == 1 ~ "#8C8C8C",
      TRUE ~ "#CACACA"
    ),
    rank_label = paste0("#", launch_rank)
  )

### |-  Segment data (lines connecting milestones per program) ----
segment_data <- raw_data |>
  mutate(
    program = factor(program, levels = rev(c(
      "Program A", "Program B",
      "Program C", "Program D",
      "Program E", "Program F"
    )))
  ) |>
  pivot_longer(
    cols      = c(ph3_end, submit, approval, launch),
    names_to  = "milestone",
    values_to = "month"
  ) |>
  group_by(program) |>
  mutate(
    x_start = month,
    x_end   = lead(month)
  ) |>
  filter(!is.na(x_end)) |>
  ungroup()

### |-  Reference line: first approval across all programs ----
first_approval_month <- raw_data |>
  filter(type == "competitor") |>
  summarise(first = min(approval)) |>
  pull(first)

first_launch_month <- raw_data |>
  filter(type == "competitor") |>
  summarise(first = min(launch)) |>
  pull(first)

# Focal program approval and launch
focal_approval <- raw_data |> filter(type == "focal") |> pull(approval)
focal_launch   <- raw_data |> filter(type == "focal") |> pull(launch)
```
#### [5. Visualization Parameters]{.smallcaps}
```{r}
#| label: params

### |-  plot aesthetics ----
colors <- get_theme_colors(
  palette = list(
    focal      = "#2E4057",
    focal_late = "#2E4057",
    winner     = "#A8A8A8",
    competitor = "#CACACA",
    segment    = "#DEDEDE",
    window     = "#2E4057",
    background = "#FAFAF8"
  )
)

### |-  titles and caption ----
title_text    <- "The Competitive Clock"

subtitle_text <- "Being first to approval does not guarantee being first to market<br>
<span style='color:#2E4057;'>**Program A (focal)**</span> reaches approval first,
but is overtaken at launch (market entry) — losing first-to-market position."

caption_text <- create_swd_caption(
  year        = 2026,
  month       = "Apr",
  source_text = "Synthetic data — illustrative only. Durations reflect plausible oncology
  launch timing ranges. No specific product or company is depicted."
)

### |- fonts ----
setup_fonts()
fonts <- get_font_families()

### |- plot theme ----
base_theme <- create_base_theme(colors)

weekly_theme <- extend_weekly_theme(
  base_theme,
  theme(
    # Axes
    axis.title.x = element_text(size = 9, color = "gray40", margin = margin(t = 8)),
    axis.title.y = element_blank(),
    axis.text.y = element_text(size = 9.5, face = "plain"),
    axis.text.x = element_text(size = 8.5, color = "gray50"),
    axis.ticks = element_blank(),

    # Grid: vertical guides only, very light
    panel.grid.major.x = element_line(color = "gray92", linewidth = 0.35),
    panel.grid.major.y = element_blank(),
    panel.grid.minor = element_blank(),

    # Milestone header strip (via facet or manual annotation)
    plot.title = element_text(size = 16, face = "bold", margin = margin(b = 4)),
    plot.subtitle = element_markdown(
      size = 9.5, lineheight = 1.4,
      color = "gray30", margin = margin(b = 16)
    ),
    plot.caption = element_markdown(
      size = 7.5, color = "gray55",
      lineheight = 1.3, hjust = 0,
      margin = margin(t = 12)
    ),
    plot.margin = margin(t = 20, r = 30, b = 16, l = 20)
  )
)

theme_set(weekly_theme)
```
#### [6. Plot]{.smallcaps}
```{r}
#| label: plot
#| output: false

### |- main plot ----
p <- ggplot() +

  # Geoms
  annotate(
    "rect",
    xmin  = first_launch_month,
    xmax  = focal_launch,
    ymin  = 0.4,
    ymax  = 6.6,
    fill  = "#2E4057",
    alpha = 0.06
  ) +
  geom_vline(
    xintercept = first_launch_month,
    linetype   = "dashed",
    linewidth  = 0.45,
    color      = "gray60",
    alpha      = 0.7
  ) +
  geom_segment(
    data      = segment_data |> filter(type == "competitor"),
    mapping   = aes(x = x_start, xend = x_end, y = program, yend = program),
    color     = colors$palette$segment,
    linewidth = 1.1
  ) +
  geom_segment(
    data      = segment_data |> filter(type == "focal"),
    mapping   = aes(x = x_start, xend = x_end, y = program, yend = program),
    color     = colors$palette$focal,
    linewidth = 1.8
  ) +
  geom_point(
    data    = timeline_long |> filter(type == "competitor", milestone != "Launch"),
    mapping = aes(x = month, y = program),
    shape   = 21,
    size    = 3.0,
    fill    = "white",
    color   = colors$palette$competitor,
    stroke  = 0.9
  ) +
  geom_point(
    data    = timeline_long |> filter(type == "focal", milestone != "Launch"),
    mapping = aes(x = month, y = program),
    shape   = 21,
    size    = 4.5,
    fill    = colors$palette$focal,
    color   = "white",
    stroke  = 1.2
  ) +
  geom_point(
    data    = launch_only,
    mapping = aes(x = launch, y = program),
    shape   = 21,
    size    = 5.0,
    fill    = launch_only$launch_color,
    color   = "white",
    stroke  = 1.3
  ) +
  geom_text(
    data     = launch_only,
    mapping  = aes(x = launch, y = program, label = rank_label),
    size     = 2.2,
    color    = "white",
    fontface = "bold",
    hjust    = 0.5,
    vjust    = 0.5
  ) +

  # Annotate
  annotate("text",
    x          = first_launch_month,
    y          = 5.65,
    label      = "First to market",
    size       = 2.4,
    color      = "gray35",
    hjust      = 0.5,
    fontface   = "bold"
  ) +
  annotate("text",
    x          = focal_launch,
    y          = 6.65,
    label      = "Second to market",
    size       = 2.4,
    color      = "#2E4057",
    hjust      = 0.5,
    fontface   = "bold"
  ) +
  annotate("text",
    x          = (first_launch_month + focal_launch) / 2,
    y          = 0.75,
    label      = "Lost window",
    size       = 2.2,
    color      = "#2E4057",
    hjust      = 0.5,
    alpha      = 0.6,
    fontface   = "italic"
  ) +
  annotate("text",
    x = mean(raw_data$ph3_end), y = 7.72,
    label = "Phase III\nReadout", size = 2.4, color = "gray65",
    hjust = 0.5, lineheight = 0.9
  ) +
  annotate("text",
    x = mean(raw_data$submit), y = 7.72,
    label = "Submission", size = 2.4, color = "gray65", hjust = 0.5
  ) +
  annotate("text",
    x = mean(raw_data$approval), y = 7.72,
    label = "Approval", size = 2.4, color = "gray65", hjust = 0.5
  ) +
  annotate("text",
    x = mean(raw_data$launch), y = 7.72,
    label = "Launch", size = 2.4, color = "gray65", hjust = 0.5
  ) +

  # Scales
  scale_x_continuous(
    name   = "Months from late-stage testing (Phase III)",
    breaks = seq(0, 35, by = 5),
    limits = c(-1, 36)
  ) +
  scale_y_discrete() +
  coord_cartesian(ylim = c(0.4, 7.95), clip = "off") +

# Labs
labs(
  title    = title_text,
  subtitle = subtitle_text,
  caption  = caption_text
)
```
#### [7. Save]{.smallcaps}
```{r}
#| label: save

### |-  plot image ----
save_plot(
  p,
  type = 'swd',
  year = 2026,
  month = 04,
  width  = 10,
  height = 8,
  )
```
#### [8. Session Info]{.smallcaps}
::: {.callout-tip collapse="true"}
##### Expand for Session Info
```{r, echo = FALSE}
#| eval: true
#| warning: false
sessionInfo()
```
:::
#### [9. GitHub Repository]{.smallcaps}
::: {.callout-tip collapse="true"}
##### Expand for GitHub Repo
The complete code for this analysis is available in [`swd_2026_04.qmd`](https://github.com/poncest/personal-website/tree/master/data_visualizations/SWD%20Challenge/2026/swd_2026_04.qmd). For the full repository, [click here](https://github.com/poncest/personal-website/).
:::
#### [10. References]{.smallcaps}
::: {.callout-tip collapse="true"}
##### Expand for References
**SWD Challenge:**
- Storytelling with Data: [Apr 2026 | visualize a timeline](https://community.storytellingwithdata.com/challenges/apr-2026-visualize-a-timeline)
**Data Sources:**
- All data are synthetic and illustrative. Timelines were constructed to reflect
plausible oncology drug development and launch timing ranges. No specific product,
company, or trial is depicted.
**Background References:**
- U.S. Food & Drug Administration. (2024). *Novel Drug Approvals for 2024*.
<https://www.fda.gov/patients/drug-development-process/step-3-clinical-research>
- Deloitte. (2024). *Measuring the return from pharmaceutical innovation*.
<https://www.deloitte.com/global/en/Industries/life-sciences/research/measuring-return-pharmaceutical-innovation.html>
**Book Reference:**
- Knaflic, C. N. (2019). *storytelling with data: let's practice!* Wiley.
:::
#### [11. Custom Functions Documentation]{.smallcaps}
::: {.callout-note collapse="true"}
##### 📦 Custom Helper Functions
This analysis uses custom functions from my personal module library for efficiency and consistency across projects.
**Functions Used:**
- **`fonts.R`**: `setup_fonts()`, `get_font_families()` - Font management with showtext
- **`social_icons.R`**: `create_social_caption()` - Generates formatted social media captions
- **`image_utils.R`**: `save_plot()` - Consistent plot saving with naming conventions
- **`base_theme.R`**: `create_base_theme()`, `extend_weekly_theme()`, `get_theme_colors()` - Custom ggplot2 themes
**Why custom functions?**\
These utilities standardize theming, fonts, and output across all my data visualizations. The core analysis (data tidying and visualization logic) uses only standard tidyverse packages.
**Source Code:**\
View all custom functions → [GitHub: R/utils](https://github.com/poncest/personal-website/tree/master/R)
:::
