---
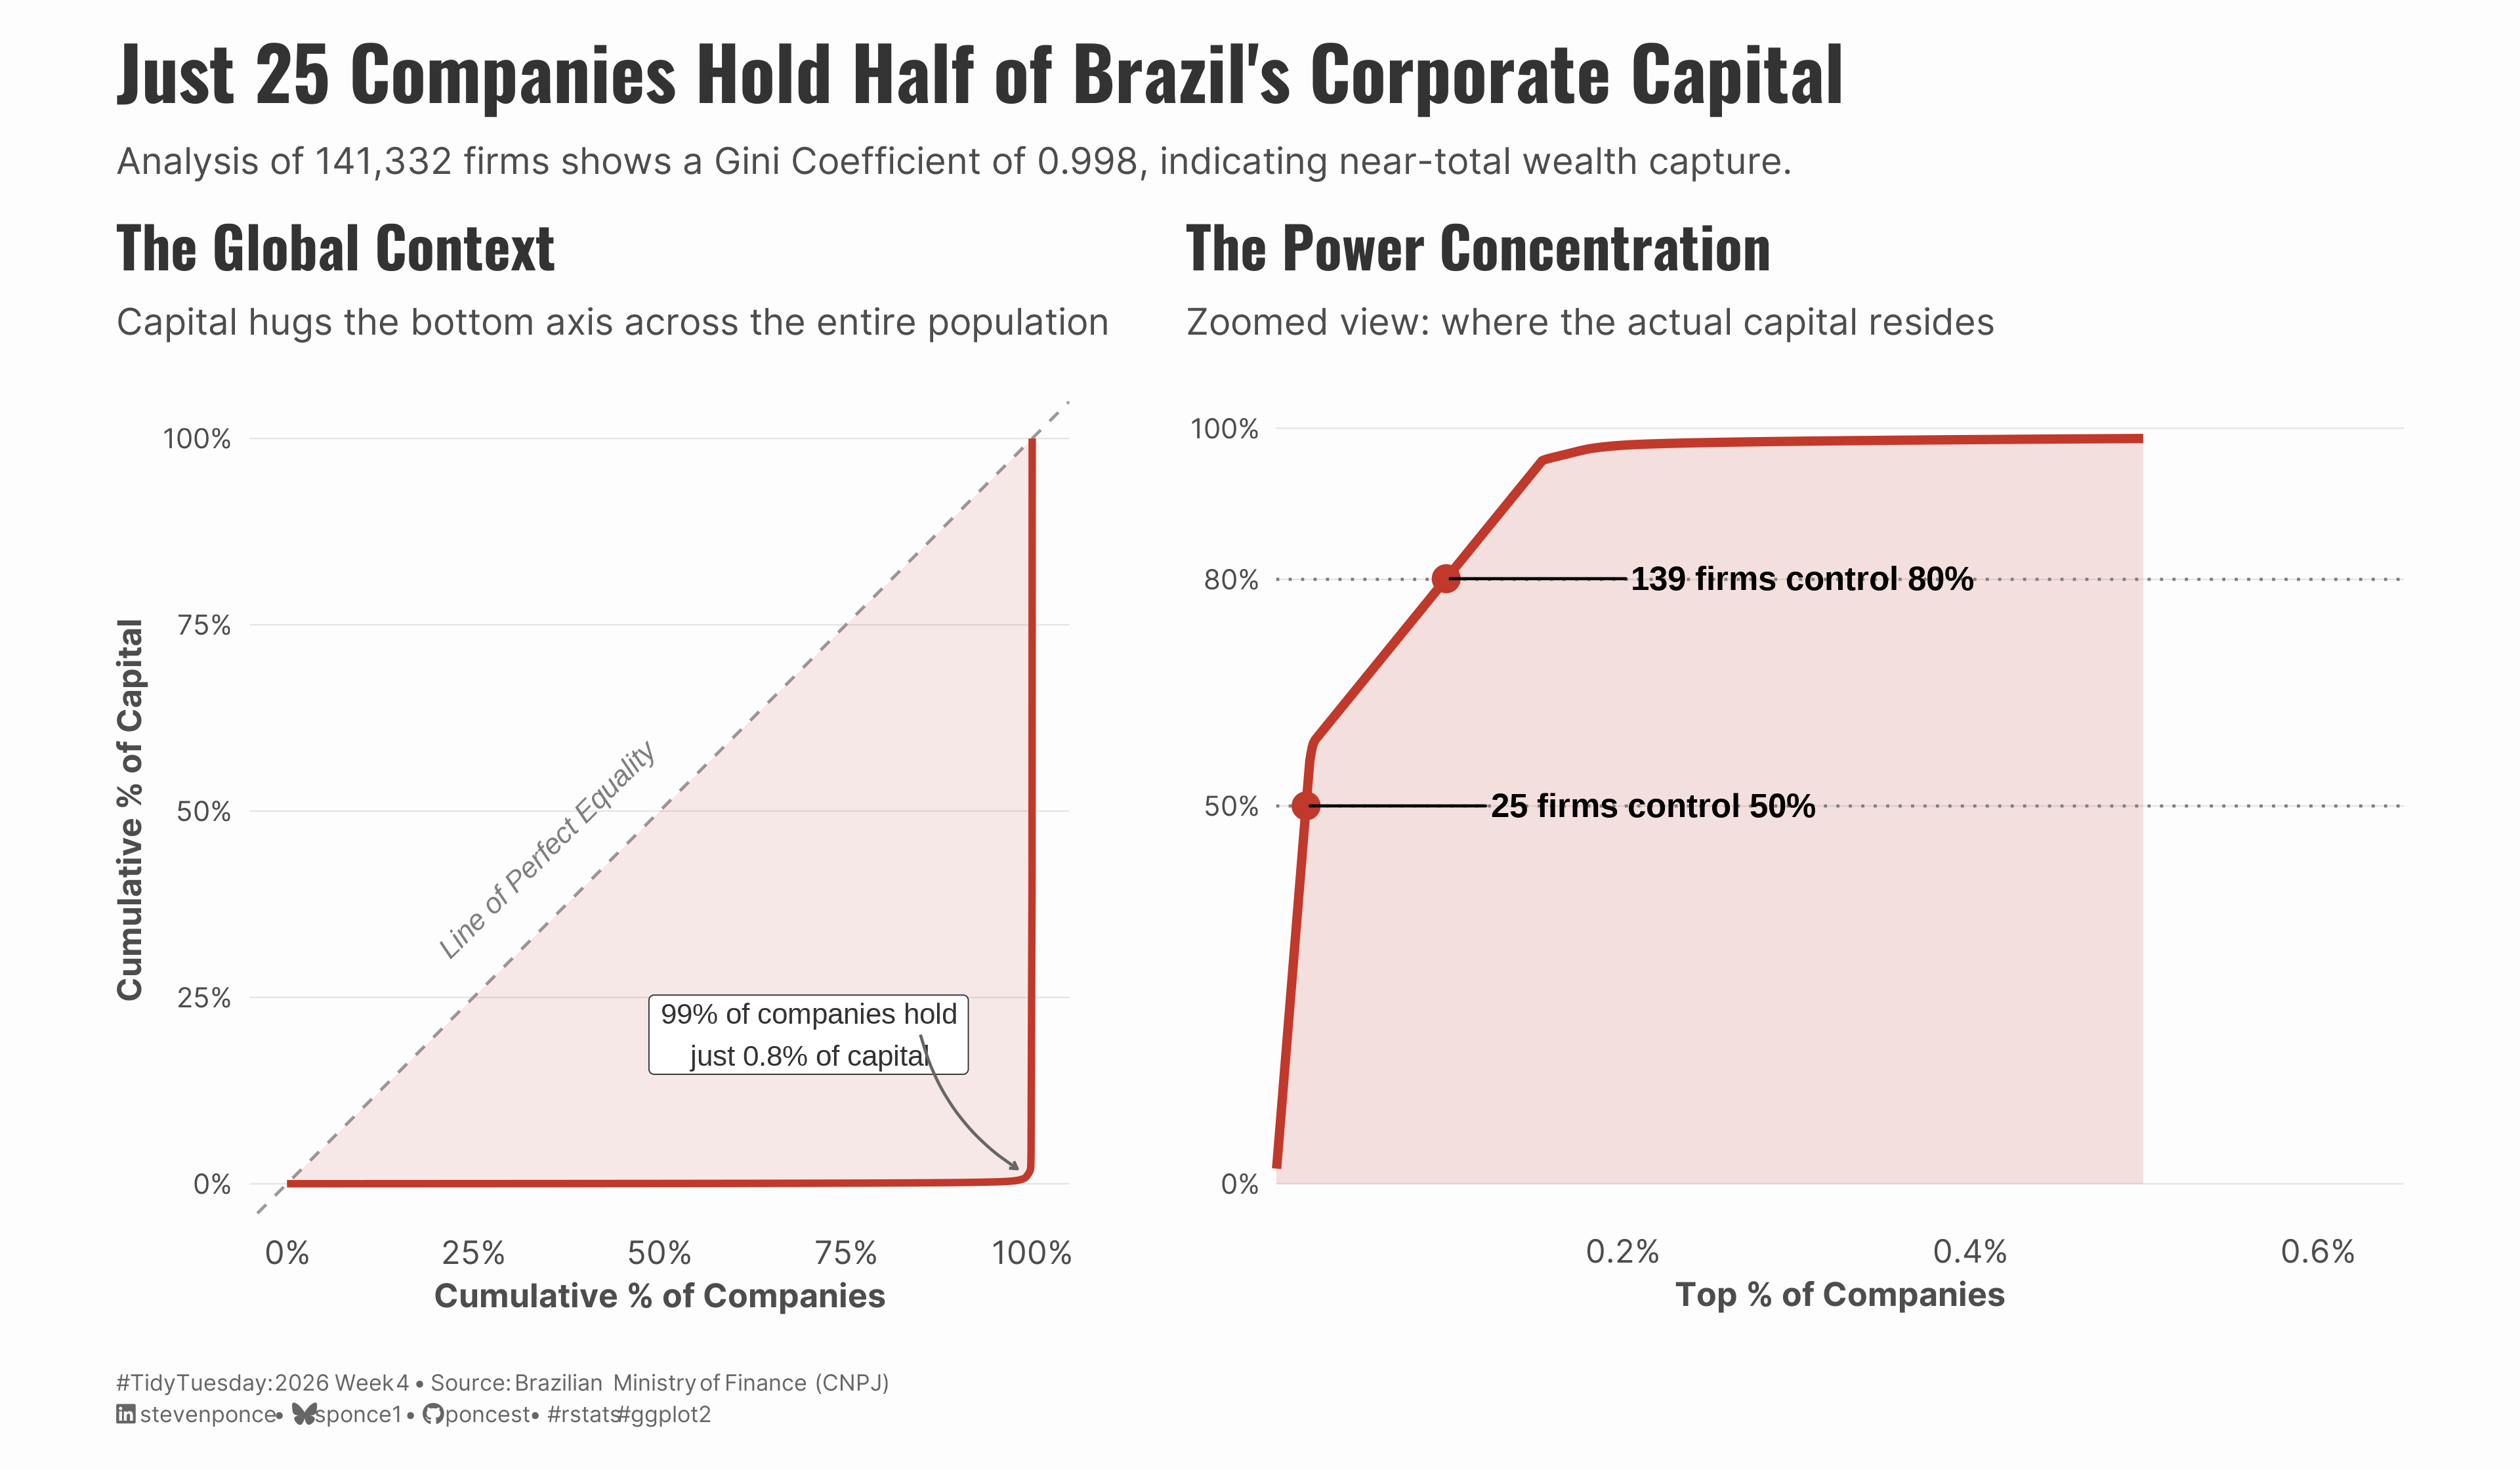
title: "Just 25 Companies Hold Half of Brazil's Corporate Capital"
subtitle: "Analysis of 141,332 firms shows a Gini Coefficient of 0.998, indicating near-total wealth capture."
description: "This visualization explores corporate capital concentration in Brazil using Lorenz curve analysis of 141,332 companies from the CNPJ open registry. A dual-panel approach reveals extreme inequality: the traditional Lorenz curve shows capital hugging the bottom axis, while a zoomed view of the top 0.6% exposes that just 25 companies control half of all corporate capital."
date: "2026-01-26"
author:
- name: "Steven Ponce"
url: "https://stevenponce.netlify.app"
citation:
url: "https://stevenponce.netlify.app/data_visualizations/TidyTuesday/2026/tt_2026_04.html"
categories: ["TidyTuesday", "2026"]
tags: [
"Lorenz Curve",
"Gini Coefficient",
"Wealth Inequality",
"Corporate Capital",
"Brazil",
"CNPJ Registry",
"Pareto Distribution",
"ggplot2",
"patchwork",
"ineq",
"Dual Panel",
"Economic Analysis"
]
image: "thumbnails/tt_2026_04.png"
format:
html:
toc: true
toc-depth: 5
code-link: true
code-fold: true
code-tools: true
code-summary: "Show code"
editor_options:
chunk_output_type: inline
execute:
freeze: true
cache: true
error: false
message: false
warning: false
eval: true
---
{#fig-1}
### [**Steps to Create this Graphic**]{.mark}
#### [1. Load Packages & Setup]{.smallcaps}
```{r}
#| label: load
#| warning: false
#| message: false
#| results: "hide"

## 1. LOAD PACKAGES & SETUP ----
suppressPackageStartupMessages({
if (!require("pacman")) install.packages("pacman")
pacman::p_load(
    tidyverse, ggtext, showtext, janitor,
    scales, glue, patchwork, ineq, ggrepel
)
})

### |- figure size ----
camcorder::gg_record(
  dir    = here::here("temp_plots"),
  device = "png",
  width  = 12,
  height = 7,
  units  = "in",
  dpi    = 320
)

# Source utility functions
suppressMessages(source(here::here("R/utils/fonts.R")))
source(here::here("R/utils/social_icons.R"))
source(here::here("R/utils/image_utils.R"))
source(here::here("R/themes/base_theme.R"))
```
#### [2. Read in the Data]{.smallcaps}
```{r}
#| label: read
#| include: true
#| eval: true
#| warning: false

tt <- tidytuesdayR::tt_load(2026, week = 04)
companies <- tt$companies |> clean_names()
rm(tt)
```
#### [3. Examine the Data]{.smallcaps}
```{r}
#| label: examine
#| include: true
#| eval: true
#| results: 'hide'
#| warning: false

glimpse(companies)
```
#### [4. Tidy Data]{.smallcaps}
```{r}
#| label: tidy
#| warning: false

companies_clean <- companies |>
  mutate(capital_stock = replace_na(capital_stock, 0))

n_companies <- nrow(companies_clean)
gini_val <- Gini(companies_clean$capital_stock)

# Lorenz Data (Bottom-Up)
lorenz_bottom <- companies_clean |>
  arrange(capital_stock) |>
  mutate(
    cum_companies = row_number() / n(),
    cum_capital = cumsum(capital_stock) / sum(capital_stock)
  )

# Pareto Data (Top-Down Zoom)
lorenz_top <- companies_clean |>
  arrange(desc(capital_stock)) |>
  mutate(
    top_pct_companies = row_number() / n(),
    cum_capital = cumsum(capital_stock) / sum(capital_stock)
  )

# Thresholds
p99 <- lorenz_bottom |> filter(cum_companies >= 0.99) |> slice_head(n = 1)
hold_50 <- lorenz_top |> filter(cum_capital >= 0.50) |> slice_head(n = 1)
hold_80 <- lorenz_top |> filter(cum_capital >= 0.80) |> slice_head(n = 1)
n_25 <- round(hold_50$top_pct_companies * n_companies)
```
#### [5. Visualization Parameters]{.smallcaps}
```{r}
#| label: params
#| include: true
#| warning: false

### |-  plot aesthetics ----
colors <- get_theme_colors(
  palette = list(
      col_curve <- "#c0392b"
  )
)

### |- titles and caption ----
title_text = str_glue("Just {n_25} Companies Hold Half of Brazil's Corporate Capital")

subtitle_text = str_glue(
    "Analysis of {comma(n_companies)} firms shows a Gini Coefficient of {round(gini_val, 3)}, indicating near-total wealth capture."
    )

caption_text <- create_social_caption(
    tt_year = 2026,
    tt_week = 04,
    source_text = "Brazilian Ministry of Finance (CNPJ)"
)

### |-  fonts ----
setup_fonts()
fonts <- get_font_families()

### |-  plot theme ----
# Start with base theme
base_theme <- create_base_theme(colors)

# Add weekly-specific theme elements
weekly_theme <- extend_weekly_theme(
  base_theme,
  theme(
    # Text styling
    plot.title = element_text(
      face = "bold", family = fonts$title, size = rel(1.4),
      color = colors$title, margin = margin(b = 10), hjust = 0
    ),
    plot.subtitle = element_text(
      face = "italic", family = fonts$subtitle, lineheight = 1.2,
      color = colors$subtitle, size = rel(0.9), margin = margin(b = 20), hjust = 0
    ),

    # Grid
    panel.grid.minor = element_blank(),
    panel.grid.major.x = element_blank(),
    panel.grid.major = element_line(color = "gray90", linewidth = 0.25),

    # Axes
    axis.title = element_text(size = rel(0.8), color = "gray30"),
    axis.text = element_text(color = "gray30"),
    axis.text.y = element_text(size = rel(0.85)),
    axis.ticks = element_blank(),

    # Facets
    strip.background = element_rect(fill = "gray95", color = NA),
    strip.text = element_text(
      face = "bold",
      color = "gray20",
      size = rel(0.9),
      margin = margin(t = 6, b = 4)
    ),
    panel.spacing = unit(1.5, "lines"),

    # Legend elements
    legend.position = "plot",
    legend.title = element_text(
      family = fonts$subtitle,
      color = colors$text, size = rel(0.8), face = "bold"
    ),
    legend.text = element_text(
      family = fonts$tsubtitle,
      color = colors$text, size = rel(0.7)
    ),
    legend.margin = margin(t = 15),

    # Plot margin
    plot.margin = margin(10, 20, 10, 20),

  )
)

# Set theme
theme_set(weekly_theme)
```
#### [6. Plot]{.smallcaps}
```{r}
#| label: plot
#| warning: false

### |- LEFT PANEL: THE MACRO PROBLEM ----
panel_left <- lorenz_bottom |>
  # Geoms
  ggplot(aes(x = cum_companies, y = cum_capital)) +
  geom_abline(slope = 1, intercept = 0, linetype = "dashed", color = "gray60") +
  geom_ribbon(aes(ymin = cum_capital, ymax = cum_companies), alpha = 0.1, fill = col_curve) +
  geom_line(color = col_curve, linewidth = 1.2) +
  # Annotations
  annotate("text",
    x = 0.35, y = 0.45, label = "Line of Perfect Equality",
    angle = 45, size = 3.5, color = "gray50", fontface = "italic"
  ) +
  annotate("label",
    x = 0.70, y = 0.20,
    label = glue("99% of companies hold\njust {percent(p99$cum_capital, 0.1)} of capital"),
    fill = "white", color = "gray20", size = 3.5, label.size = 0.2
  ) +
  annotate("curve",
    x = 0.85, y = 0.20, xend = 0.98, yend = 0.02,
    curvature = 0.2, color = "gray40", arrow = arrow(length = unit(0.1, "cm"))
  ) +
  # Scales
  scale_x_continuous(labels = percent_format()) +
  scale_y_continuous(labels = percent_format()) +
  coord_fixed() +
  # Labs
  labs(
    title = "The Global Context",
    subtitle = "Capital hugs the bottom axis across the entire population",
    x = "Cumulative % of Companies",
    y = "Cumulative % of Capital"
  )

### |- RIGHT PANEL: THE POWER CONCENTRATION----
panel_right <- lorenz_top |>
  filter(top_pct_companies <= 0.005) |>
  # Geoms
  ggplot(aes(x = top_pct_companies, y = cum_capital)) +
  geom_area(fill = col_curve, alpha = 0.15) +
  geom_hline(yintercept = c(0.5, 0.8), linetype = "dotted", color = "gray50") +
  geom_line(color = col_curve, linewidth = 1.5) +
  geom_point(data = bind_rows(hold_50, hold_80), size = 4, color = col_curve) +
  geom_text_repel(
    data = bind_rows(hold_50, hold_80),
    aes(label = glue("{comma(round(top_pct_companies * n_companies))} firms control {percent(cum_capital)}")),
    nudge_x = 0.001, direction = "y", hjust = 0, size = 4, fontface = "bold"
  ) +
  # Scales
  scale_x_continuous(labels = percent_format(accuracy = 0.1), expand = expansion(mult = c(0, 0.3))) +
  scale_y_continuous(labels = percent_format(), breaks = c(0, 0.5, 0.8, 1)) +
  coord_cartesian(clip = "off") +
  # Labs
  labs(
    title = "The Power Concentration",
    subtitle = "Zoomed view: where the actual capital resides",
    x = "Top % of Companies",
    y = NULL
  )

### |- COMBINE ----
combined_plot <-(panel_left + panel_right) +
    plot_annotation(
        title = title_text,
        subtitle = subtitle_text,
        caption = caption_text,
        theme = theme(
    plot.title = element_text(
      size = rel(1.8),
      family = fonts$title,
      face = "bold",
      color = colors$title,
      lineheight = 1.15,
      margin = margin(t = 5, b = 5)
    ),
    plot.subtitle = element_text(
      size = rel(0.9),
      family = fonts$subtitle,
      color = colors$subtitle,
      lineheight = 1.5,
      margin = margin(t = 5, b = 5)
    ),
    plot.caption = element_markdown(
      size = rel(0.55),
      family = fonts$subtitle,
      color = colors$caption,
      hjust = 0,
      lineheight = 1.4,
      margin = margin(t = 10, b = 5)
    ),
  )
)
```
#### [7. Save]{.smallcaps}
```{r}
#| label: save
#| warning: false

### |-  plot image ----
save_plot_patchwork(
  plot = combined_plot,
  type = "tidytuesday",
  year = 2026,
  week = 04,
  width  = 12,
  height = 7,
  )
```
#### [8. Session Info]{.smallcaps}
::: {.callout-tip collapse="true"}
##### Expand for Session Info
```{r, echo = FALSE}
#| eval: true
#| warning: false
sessionInfo()
```
:::
#### [9. GitHub Repository]{.smallcaps}
::: {.callout-tip collapse="true"}
##### Expand for GitHub Repo
The complete code for this analysis is available in [`tt_2026_04.qmd`](https://github.com/poncest/personal-website/blob/master/data_visualizations/TidyTuesday/2026/tt_2026_04.qmd).
For the full repository, [click here](https://github.com/poncest/personal-website/).
:::
#### [10. References]{.smallcaps}
::: {.callout-tip collapse="true"}
##### Expand for References
1. **Data Source:**
- TidyTuesday 2026 Week 04: [Brazilian Companies](https://github.com/rfordatascience/tidytuesday/blob/main/data/2026/2026-01-27/readme.md)
- Brazilian Ministry of Finance: [CNPJ Open Data](https://dados.gov.br/dados/conjuntos-dados/cadastro-nacional-da-pessoa-juridica---cnpj)
- Data Dictionary: [CNPJ Metadata (PDF)](https://www.gov.br/receitafederal/dados/cnpj-metadados.pdf)
2. **Methodology:**
- Lorenz Curve: [Wikipedia](https://en.wikipedia.org/wiki/Lorenz_curve)
- Gini Coefficient: [Wikipedia](https://en.wikipedia.org/wiki/Gini_coefficient)
- R Package `ineq`: [CRAN Documentation](https://cran.r-project.org/package=ineq)
:::
#### [11. Custom Functions Documentation]{.smallcaps}
::: {.callout-note collapse="true"}
##### 📦 Custom Helper Functions
This analysis uses custom functions from my personal module library for efficiency and consistency across projects.
**Functions Used:**
- **`fonts.R`**: `setup_fonts()`, `get_font_families()` - Font management with showtext
- **`social_icons.R`**: `create_social_caption()` - Generates formatted social media captions
- **`image_utils.R`**: `save_plot()` - Consistent plot saving with naming conventions
- **`base_theme.R`**: `create_base_theme()`, `extend_weekly_theme()`, `get_theme_colors()` - Custom ggplot2 themes
**Why custom functions?**\
These utilities standardize theming, fonts, and output across all my data visualizations. The core analysis (data tidying and visualization logic) uses only standard tidyverse packages.
**Source Code:**\
View all custom functions → [GitHub: R/utils](https://github.com/poncest/personal-website/tree/master/R)
:::
