---
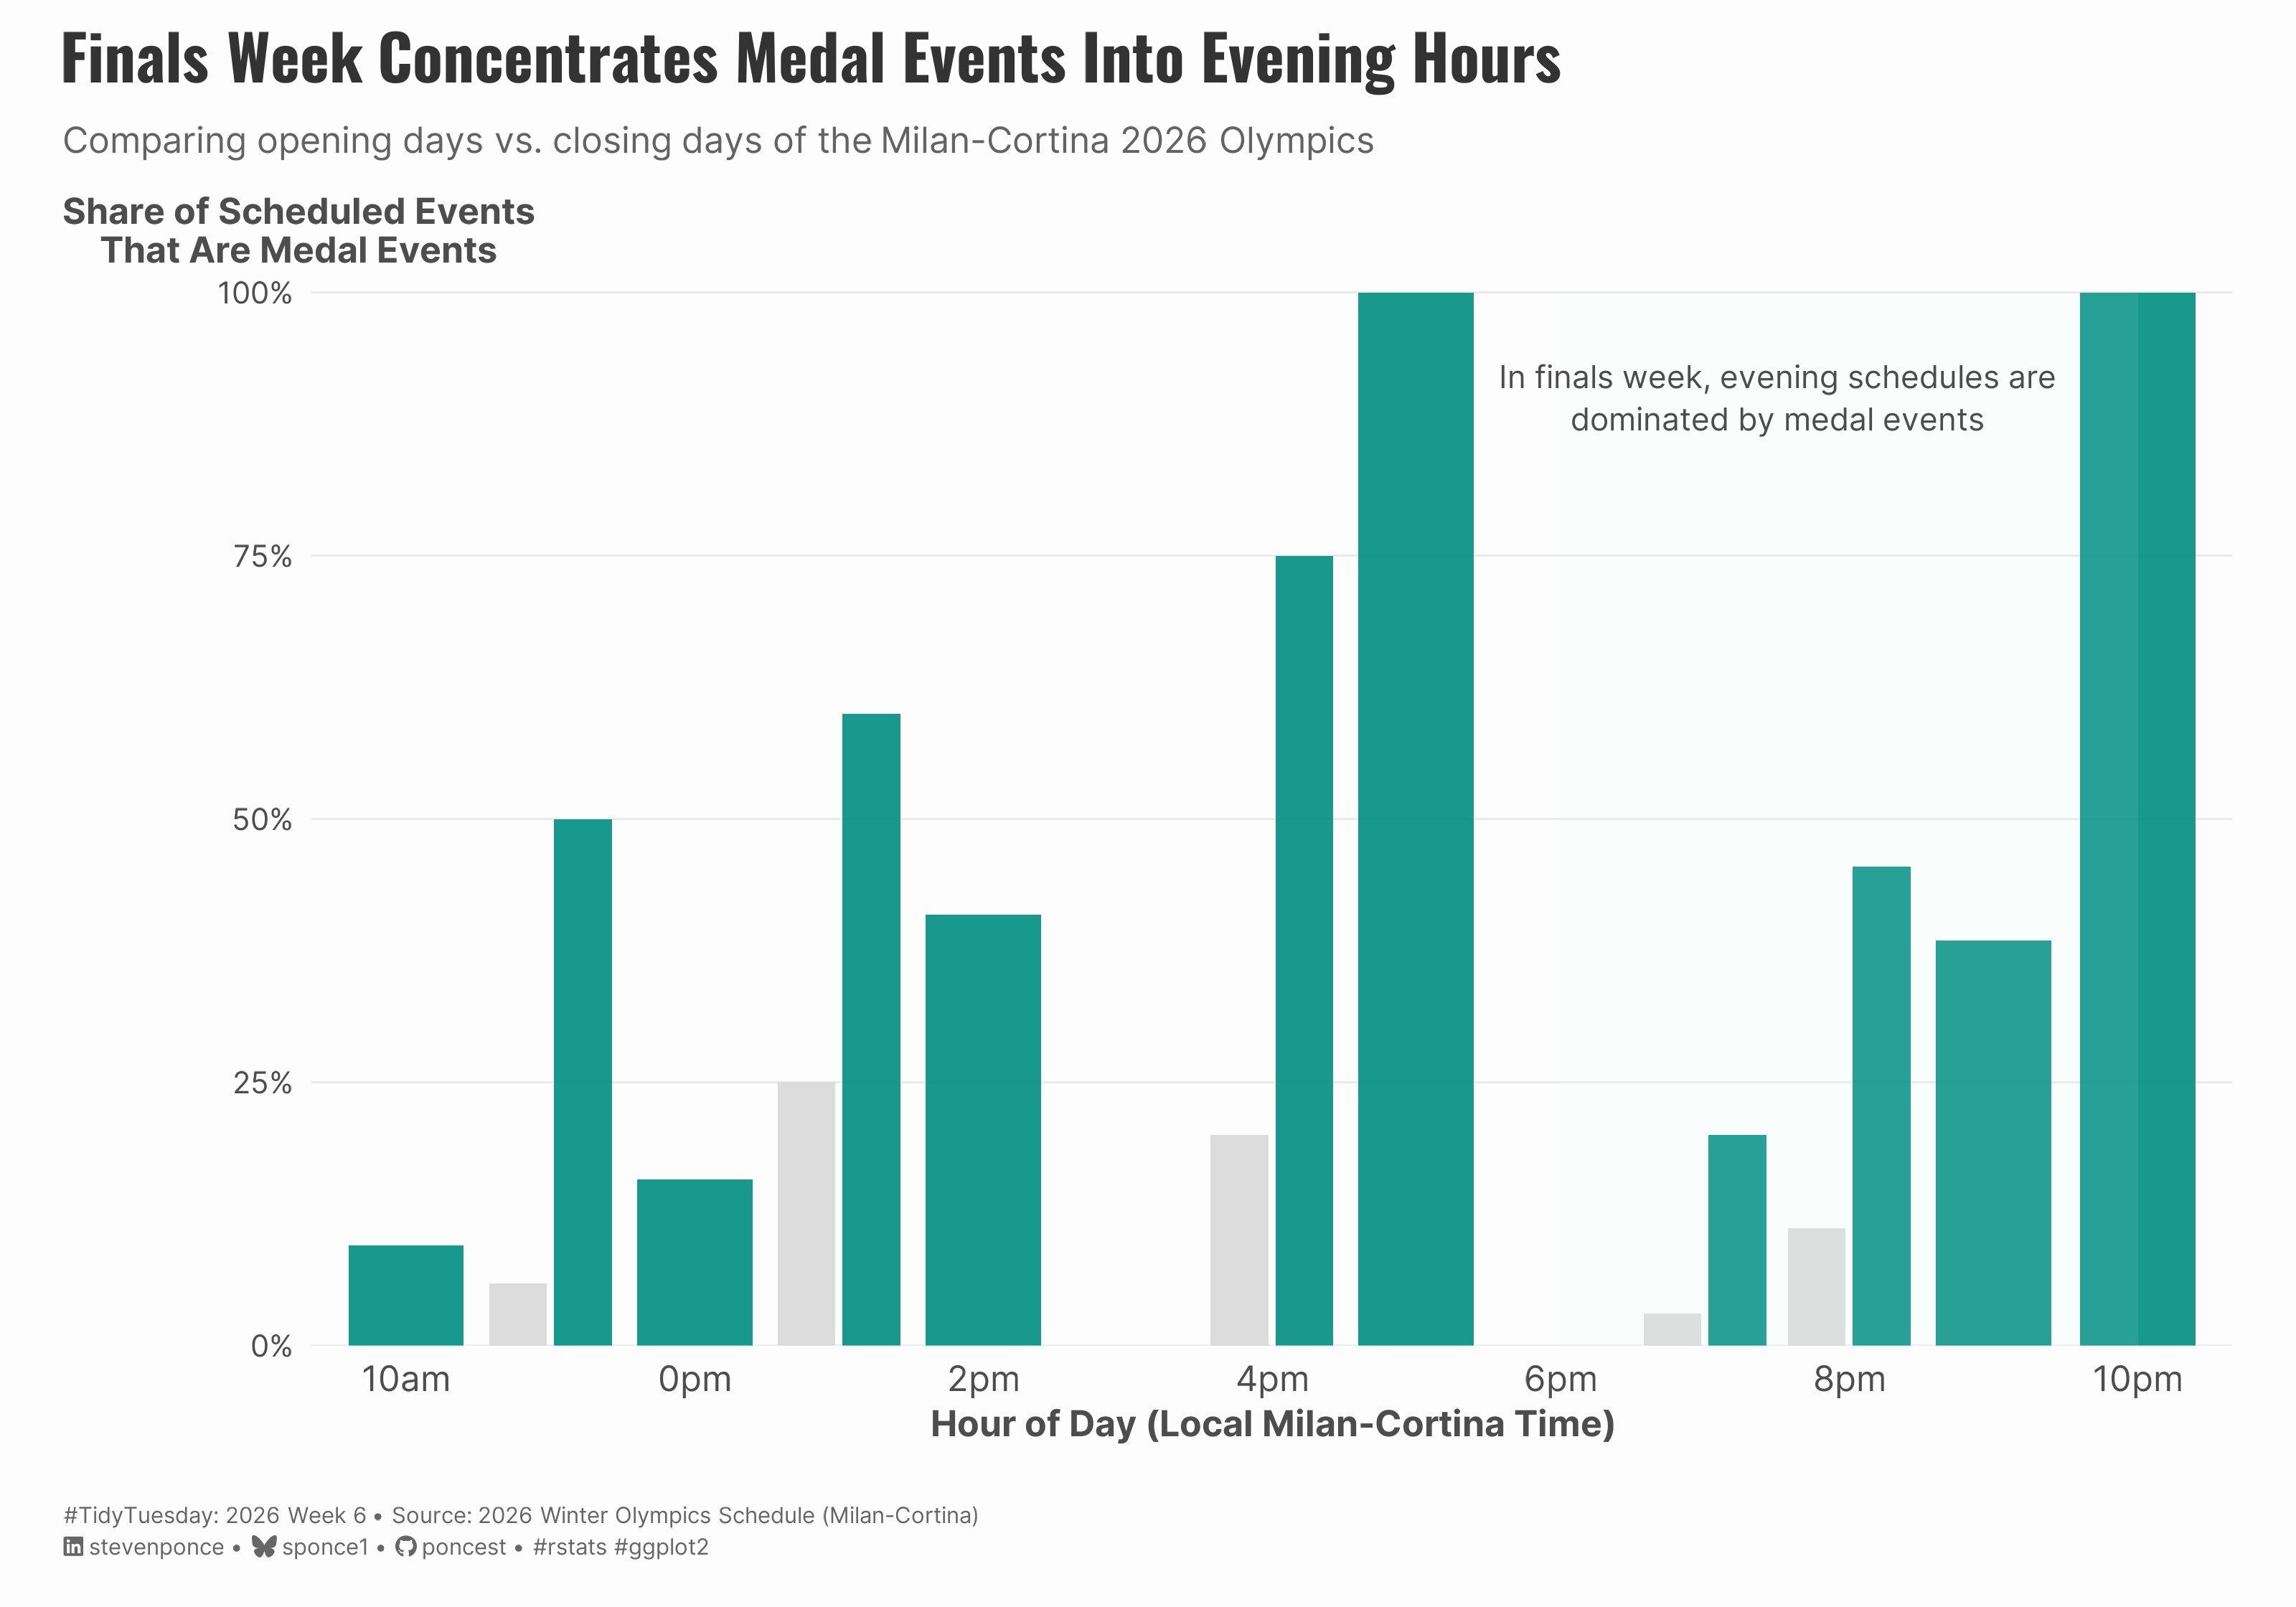
title: "Finals Week Concentrates Medal Events Into Evening Hours"
subtitle: "Comparing opening days vs. closing days of the Milan-Cortina 2026 Olympics"
description: "Comparing opening versus closing days of the Milan-Cortina 2026 Winter Olympics reveals how finals week dramatically concentrates medal events into evening hours, transforming the schedule from scattered daytime competition to evening-focused spectacle."
date: "2026-02-09"
author:
- name: "Steven Ponce"
url: "https://stevenponce.netlify.app"
citation:
url: "https://stevenponce.netlify.app/data_visualizations/TidyTuesday/2026/tt_2026_06.html"
categories: ["TidyTuesday", "2026"]
tags: [
"Winter Olympics",
"Sports Scheduling",
"Event Planning",
"Grouped Bar Chart",
"Comparative Analysis",
"ggplot2",
"Milan-Cortina 2026",
"Olympic Broadcasting"
]
image: "thumbnails/tt_2026_06.png"
format:
html:
toc: true
toc-depth: 5
code-link: true
code-fold: true
code-tools: true
code-summary: "Show code"
editor_options:
chunk_output_type: inline
execute:
freeze: true
cache: true
error: false
message: false
warning: false
eval: true
---
{#fig-1}
### [**Steps to Create this Graphic**]{.mark}
#### [1. Load Packages & Setup]{.smallcaps}
```{r}
#| label: load
#| warning: false
#| message: false
#| results: "hide"

## 1. LOAD PACKAGES & SETUP ----
suppressPackageStartupMessages({
if (!require("pacman")) install.packages("pacman")
pacman::p_load(
    tidyverse, ggtext, showtext, janitor,
    scales, glue
)
})

### |- figure size ----
camcorder::gg_record(
  dir    = here::here("temp_plots"),
  device = "png",
  width  = 10,
  height = 7,
  units  = "in",
  dpi    = 320
)

# Source utility functions
suppressMessages(source(here::here("R/utils/fonts.R")))
source(here::here("R/utils/social_icons.R"))
source(here::here("R/utils/image_utils.R"))
source(here::here("R/themes/base_theme.R"))
```
#### [2. Read in the Data]{.smallcaps}
```{r}
#| label: read
#| include: true
#| eval: true
#| warning: false

# tt <- tidytuesdayR::tt_load(2026, week = 06)
# schedule <- tt$schedule |> clean_names()
# rm(tt)
schedule <- readr::read_csv('https://raw.githubusercontent.com/rfordatascience/tidytuesday/main/data/2026/2026-02-10/schedule.csv')
```
#### [3. Examine the Data]{.smallcaps}
```{r}
#| label: examine
#| include: true
#| eval: true
#| results: 'hide'
#| warning: false

glimpse(schedule)
```
#### [4. Tidy Data]{.smallcaps}
```{r}
#| label: tidy
#| warning: false

### |-  data cleaning ----
schedule_clean <- schedule |>
  mutate(
    olympic_day = as.numeric(date - min(date)) + 1,
    max_day = max(olympic_day),
    hour_local = hour(start_datetime_local),

    # Two periods for direct comparison
    period = case_when(
      olympic_day <= 3 ~ "Opening Days (1-3)",
      olympic_day >= max_day - 2 ~ "Finals Week",
      TRUE ~ NA_character_
    )
  ) |>
  filter(!is.na(period)) |>
  mutate(period = fct_relevel(period, "Opening Days (1-3)", "Finals Week"))

### |-  calculate medal event share ----
medal_share_comparison <- schedule_clean |>
  count(period, hour_local, is_medal_event) |>
  group_by(period, hour_local) |>
  mutate(
    total_events = sum(n),
    pct = n / total_events * 100
  ) |>
  ungroup() |>
  filter(is_medal_event == TRUE)
```
#### [5. Visualization Parameters]{.smallcaps}
```{r}
#| label: params
#| include: true
#| warning: false

### |-  plot aesthetics ----
colors <- get_theme_colors(
  palette = list(
      col_opening = "#CFCFCF",
      col_closing = "#0d9488",
      col_primetime_shade = "#ccfbf1",
      col_text_dark = "gray30"
  )
)

### |- titles and caption ----
title_text <- "Finals Week Concentrates Medal Events Into Evening Hours"

subtitle_text <- "Comparing opening days vs. closing days of the Milan-Cortina 2026 Olympics"

caption_text <- create_social_caption(
    tt_year = 2026,
    tt_week = 06,
    source_text = "2026 Winter Olympics Schedule (Milan-Cortina)"
)

### |-  fonts ----
setup_fonts()
fonts <- get_font_families()

### |-  plot theme ----
# Start with base theme
base_theme <- create_base_theme(colors)

# Add weekly-specific theme elements
weekly_theme <- extend_weekly_theme(
  base_theme,
  theme(
    # Text styling
    plot.title = element_text(
      face = "bold", family = fonts$title, size = rel(1.3),
      color = colors$title, margin = margin(b = 10), hjust = 0
    ),
    plot.subtitle = element_markdown(
      face = "italic", family = fonts$subtitle, lineheight = 1.2,
      color = colors$subtitle, size = rel(0.8), margin = margin(b = 20), hjust = 0
    ),

    # Grid
    panel.grid.minor = element_blank(),
    panel.grid.major.x = element_blank(),
    panel.grid.major = element_line(color = "gray90", linewidth = 0.25),

    # Axes
    axis.title = element_text(size = rel(0.8), color = "gray30"),
    axis.text = element_text(color = "gray30"),
    axis.text.y = element_text(size = rel(0.85)),
    axis.ticks = element_blank(),

    # Facets
    strip.background = element_rect(fill = "gray95", color = NA),
    strip.text = element_text(
      face = "bold",
      color = "gray20",
      size = rel(0.9),
      margin = margin(t = 6, b = 4)
    ),
    panel.spacing = unit(1.5, "lines"),

    # Legend elements
    legend.position = "plot",
    legend.title = element_text(
      family = fonts$subtitle,
      color = colors$text, size = rel(0.8), face = "bold"
    ),
    legend.text = element_text(
      family = fonts$tsubtitle,
      color = colors$text, size = rel(0.7)
    ),
    legend.margin = margin(t = 15),

    # Plot margin
    plot.margin = margin(10, 20, 10, 20),

  )
)

# Set theme
theme_set(weekly_theme)
```
#### [6. Plot]{.smallcaps}
```{r}
#| label: plot
#| warning: false

### |- final plot ----
p <- medal_share_comparison |>
  ggplot(aes(x = hour_local, y = pct, fill = period)) +

  # Geoms
  geom_col(
    aes(alpha = period),
    position = position_dodge(width = 0.9),
    width = 0.8
  ) +
  # Annotate
  annotate(
    "rect",
    xmin = 18, xmax = 22,
    ymin = 0, ymax = 100,
    fill = colors$palette$col_primetime_shade,
    alpha = 0.08
  ) +
  annotate(
    "text",
    x = 19.5, y = 90,
    label = "In finals week, evening schedules are\ndominated by medal events",
    family = fonts$text,
    size = 3.5,
    color = colors$palette$col_text_dark,
    lineheight = 1.1,
    hjust = 0.5
  ) +
  # Scales
  scale_fill_manual(
    values = c(
      "Opening Days (1-3)" = colors$palette$col_opening,
      "Finals Week" = colors$palette$col_closing
    )
  ) +
  scale_alpha_manual(
    values = c("Opening Days (1-3)" = 0.7, "Finals Week" = 0.95),
    guide = "none"
  ) +
  scale_x_continuous(
    breaks = seq(10, 22, 2),
    labels = function(x) paste0(x %% 12, ifelse(x < 12, "am", "pm")),
    expand = expansion(mult = c(0.02, 0.02))
  ) +
  scale_y_continuous(
    labels = function(x) paste0(x, "%"),
    limits = c(0, 100),
    expand = expansion(mult = c(0, 0.05))
  ) +
  # Labs
  labs(
    title = title_text,
    subtitle = subtitle_text,
    x = "Hour of Day (Local Milan-Cortina Time)",
    y = "Share of Scheduled Events\nThat Are Medal Events",
    caption = caption_text
  ) +
  # Theme
  theme(
    axis.title.y = element_text(
      angle = 0,
      vjust = 1.04,
      hjust = 0.5,
      margin = margin(r = -100)
    ),
    plot.title = element_markdown(
      size = rel(1.4),
      family = fonts$title,
      face = "bold",
      color = colors$title,
      lineheight = 1.15,
      margin = margin(t = 0, b = 5)
    ),
    plot.subtitle = element_markdown(
      size = rel(0.8),
      family = fonts$subtitle,
      color = alpha(colors$subtitle, 0.88),
      lineheight = 1.5,
      margin = margin(t = 5, b = 25)
    ),
    plot.caption = element_markdown(
      size = rel(0.5),
      family = fonts$subtitle,
      color = colors$caption,
      hjust = 0,
      lineheight = 1.4,
      margin = margin(t = 20, b = 5)
    )
  )
```
#### [7. Save]{.smallcaps}
```{r}
#| label: save
#| warning: false

### |-  plot image ----
save_plot(
  plot = p,
  type = "tidytuesday",
  year = 2026,
  week = 06,
  width  = 10,
  height = 7,
  )
```
#### [8. Session Info]{.smallcaps}
::: {.callout-tip collapse="true"}
##### Expand for Session Info
```{r, echo = FALSE}
#| eval: true
#| warning: false
sessionInfo()
```
:::
#### [9. GitHub Repository]{.smallcaps}
::: {.callout-tip collapse="true"}
##### Expand for GitHub Repo
The complete code for this analysis is available in [`tt_2026_06.qmd`](https://github.com/poncest/personal-website/blob/master/data_visualizations/TidyTuesday/2026/tt_2026_06.qmd).
For the full repository, [click here](https://github.com/poncest/personal-website/).
:::
#### [10. References]{.smallcaps}
::: {.callout-tip collapse="true"}
##### Expand for References
1. **Data Source:**
- TidyTuesday 2026 Week 06: [2026 Winter Olympics!](https://github.com/rfordatascience/tidytuesday/blob/main/data/2026/2026-02-10/readme.md)
:::
#### [11. Custom Functions Documentation]{.smallcaps}
::: {.callout-note collapse="true"}
##### 📦 Custom Helper Functions
This analysis uses custom functions from my personal module library for efficiency and consistency across projects.
**Functions Used:**
- **`fonts.R`**: `setup_fonts()`, `get_font_families()` - Font management with showtext
- **`social_icons.R`**: `create_social_caption()` - Generates formatted social media captions
- **`image_utils.R`**: `save_plot()` - Consistent plot saving with naming conventions
- **`base_theme.R`**: `create_base_theme()`, `extend_weekly_theme()`, `get_theme_colors()` - Custom ggplot2 themes
**Why custom functions?**\
These utilities standardize theming, fonts, and output across all my data visualizations. The core analysis (data tidying and visualization logic) uses only standard tidyverse packages.
**Source Code:**\
View all custom functions → [GitHub: R/utils](https://github.com/poncest/personal-website/tree/master/R)
:::
