• Steven Ponce
  • About
  • Data Visualizations
  • Behind the Viz
  • Projects
  • Resume
  • Email

On this page

  • Steps to Create this Graphic
    • 1. Load Packages & Setup
    • 2. Read in the Data
    • 3. Examine the Data
    • 4. Tidy Data
    • 5. Visualization Parameters
    • 6. Plot
  • 7. Save
    • 8. Session Info
    • 9. GitHub Repository
    • 10. References
    • 11. Custom Functions Documentation

The biblical canon tells only part of the story

  • Show All Code
  • Hide All Code

  • View Source

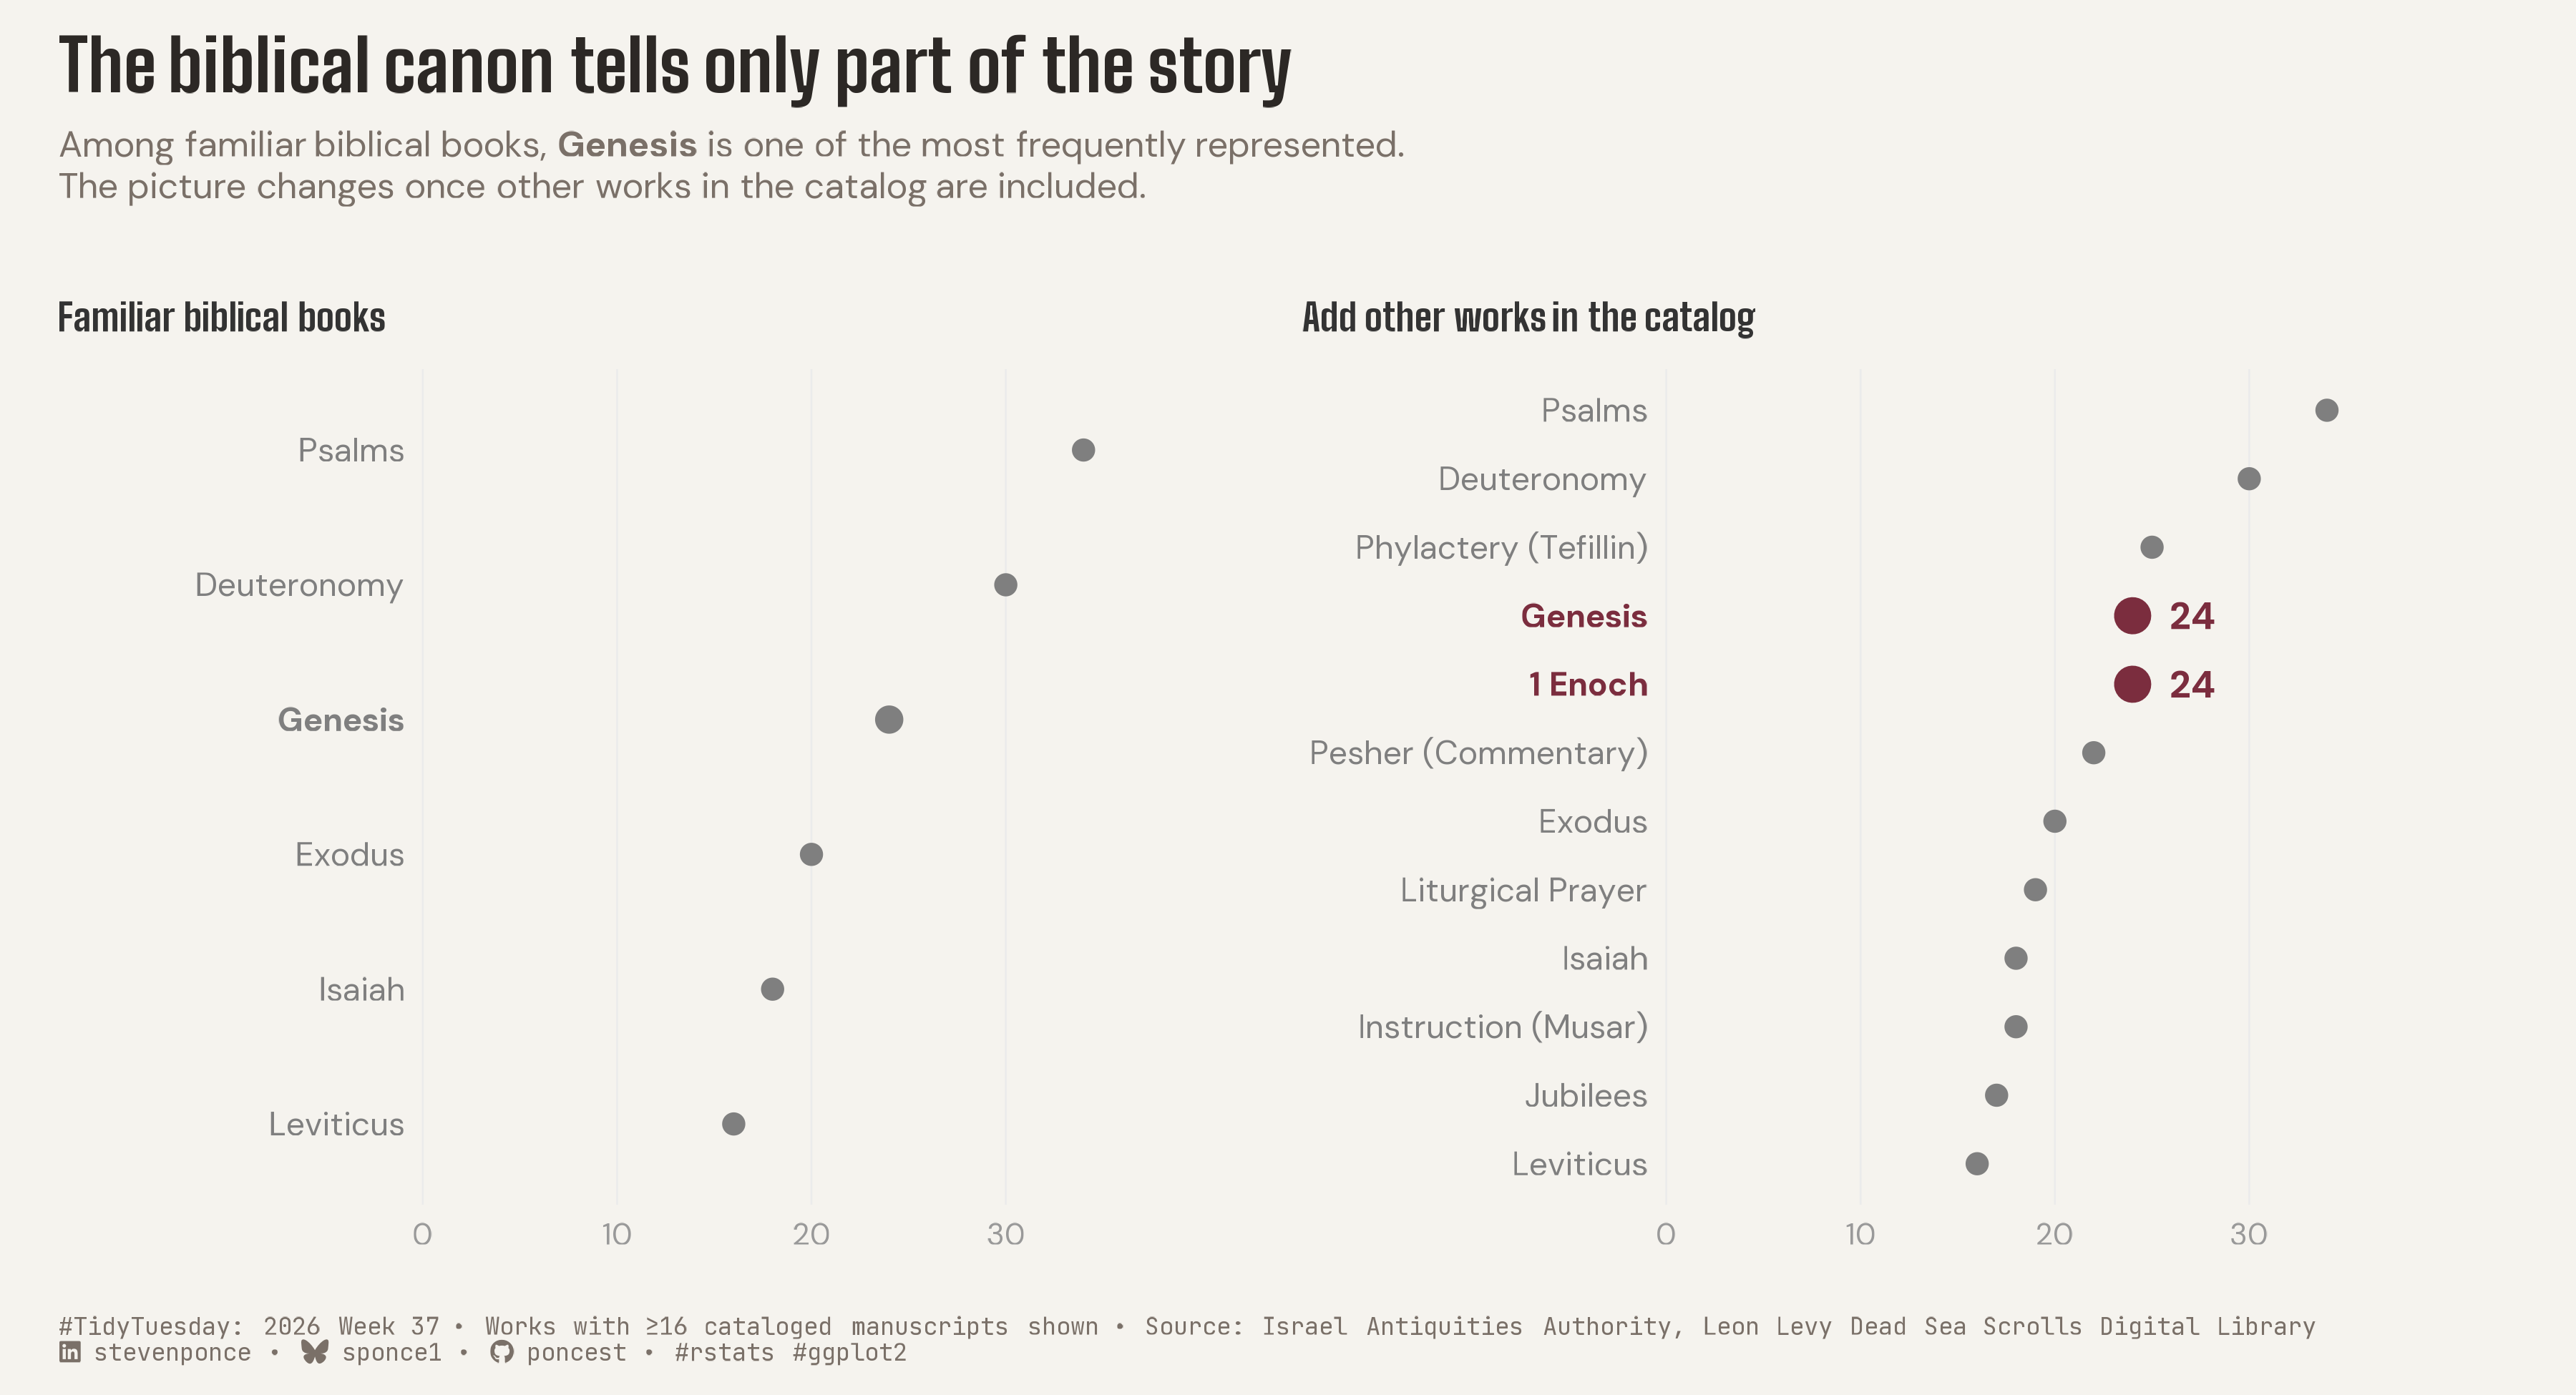
Among familiar biblical books, Genesis is one of the most frequently represented. The picture changes once other works in the catalog are included.

TidyTuesday
Data Visualization
R Programming
2026
A two-panel dot plot compares manuscript counts for works in the Dead Sea Scrolls catalog, moving from six familiar biblical books to the fuller set of works with at least 16 cataloged manuscripts. The reveal: 1 Enoch matches Genesis at 24 manuscripts each, outnumbering Exodus, Isaiah, and Leviticus. Built in R with ggplot2, ggtext, and patchwork.
Author

Steven Ponce

Published

September 14, 2026

Figure 1: Two-panel dot plot of Dead Sea Scrolls manuscript counts (works with ≥16 manuscripts). Left panel: six familiar biblical books, Genesis at 24. Right panel adds other catalog works — 1 Enoch also totals 24, tying Genesis and exceeding Exodus, Isaiah, and Leviticus, showing the biblical canon captures only part of this collection’s textual world.

Steps to Create this Graphic

1. Load Packages & Setup

Show code
```{r}
#| label: load
#| warning: false
#| message: false      
#| results: "hide"     

## 1. LOAD PACKAGES & SETUP ----
suppressPackageStartupMessages({
if (!require("pacman")) install.packages("pacman")
pacman::p_load(
    tidyverse, ggtext, showtext, janitor, ggrepel,      
    scales, glue, skimr, ggview, patchwork
    )
})

# Source utility functions
suppressMessages(source(here::here("R/utils/fonts.R")))
source(here::here("R/utils/social_icons.R"))
source(here::here("R/utils/image_utils.R"))
source(here::here("R/themes/base_theme.R"))
```

2. Read in the Data

Show code
```{r}
#| label: read
#| include: true
#| eval: true
#| warning: false

## 2. READ IN THE DATA ----
tt <- tidytuesdayR::tt_load(2026, week = 37)
dead_sea_scrolls <- tt$dead_sea_scrolls
rm(tt)
```

3. Examine the Data

Show code
```{r}
#| label: examine
#| include: true
#| eval: true
#| results: 'hide'
#| warning: false

## 3. EXAMINING THE DATA ----
glimpse(dead_sea_scrolls)
skim_without_charts(dead_sea_scrolls)
```

4. Tidy Data

Show code
```{r}
#| label: tidy
#| warning: false

### |- standardized work counts ----
book_counts <- dead_sea_scrolls |>
  filter(!is.na(biblical_book)) |>
  count(biblical_book, canon_status, name = "n_manuscripts", sort = TRUE)

### |- hero cutoff ----
## Cut at n >= 16. Clean boundary — no tied works are split across it (the
## next cluster, n = 11, has four works tied together).
hero_set <- book_counts |>
  filter(n_manuscripts >= 16)
```

5. Visualization Parameters

Show code
```{r}
#| label: params
#| include: true
#| warning: false

### |- plot aesthetics ----
clrs <- get_theme_colors(
    palette = c("hero" = "#7B2D3E", "context" = "gray50")
)

### |- titles and caption ----
title_text <- str_glue("The biblical canon tells only part of the story")

subtitle_text <- str_glue(
    "Among familiar biblical books, **Genesis** is one of the most frequently ",
    "represented.<br>The picture changes once other works in the catalog are included."
)

caption_text <- create_social_caption(
    tt_year = 2026,
    tt_week = 37,
    source_text = "Israel Antiquities Authority, Leon Levy Dead Sea Scrolls Digital Library"
)
caption_text <- str_replace(
    caption_text,
    "Source:",
    "Works with \u226516 cataloged manuscripts shown \u2022 Source:"
)

### |- fonts ----
setup_fonts()
fonts <- get_font_families()

### |- plot theme ----
base_theme <- create_base_theme(clrs)

weekly_theme <- extend_weekly_theme(
  base_theme,
  theme(
    plot.title = element_textbox_simple(
      size = rel(1.6),
      face = "bold",
      family = fonts$title_1,
      color = clrs$title,
      lineheight = 1.1,
      margin = margin(b = 8)
    ),
    plot.subtitle = element_textbox_simple(
      size = rel(0.8), lineheight = 1.25,
      family = fonts$subtitle,
      color = clrs$subtitle,
      margin = margin(b = 20)
    ),
    plot.caption = element_textbox_simple(
      size = rel(0.55), lineheight = 1.15,
      family = fonts$caption,
      color = clrs$caption,
      margin = margin(t = 12)
    ),
    axis.text.y = element_blank(),
    axis.ticks.y = element_blank(),
    axis.text.x = element_text(family = fonts$text, size = rel(0.85), color = "gray60"),
    axis.title = element_blank(),
    panel.grid.major.y = element_blank(),
    panel.grid.major.x = element_line(color = "gray92", linewidth = 0.3),
    panel.grid.minor = element_blank(),
    axis.ticks.x = element_blank(),
    legend.position = "none",
    plot.margin = margin(t = 12, r = 20, b = 10, l = 10)
  )
)

theme_set(weekly_theme)
```

6. Plot

Show code
```{r}
#| label: plot
#| warning: false

### |- panel 1: familiar biblical books ----
panel1_data <- hero_set |>
  filter(canon_status == "Protocanonical") |>
  mutate(
    emphasis = if_else(biblical_book == "Genesis", "continuity", "context"),
    accent_color = clrs$palette[["context"]],
    biblical_book = fct_reorder(biblical_book, n_manuscripts)
  )

### |- panel 2: add other works in the catalog ----
panel2_data <- hero_set |>
  mutate(
    emphasis = if_else(biblical_book %in% c("Genesis", "1 Enoch"), "hero", "context"),
    accent_color = if_else(emphasis == "hero", clrs$palette[["hero"]], clrs$palette[["context"]]),
    biblical_book = fct_reorder(biblical_book, n_manuscripts)
  )

### |- shared x scale ----
shared_x <- list(
  scale_x_continuous(limits = c(-16, 38), breaks = seq(0, 30, 10))
)

### |- panel builder ----
build_panel <- function(data, panel_title) {
  ggplot(data, aes(x = n_manuscripts, y = biblical_book)) +
    geom_point(aes(color = accent_color, size = emphasis)) +
    geom_text(
      data = filter(data, emphasis == "hero"),
      aes(label = n_manuscripts),
      color = clrs$palette[["hero"]],
      fontface = "bold",
      family = fonts$text,
      size = 4.2,
      hjust = -0.9
    ) +
    geom_text(
      aes(
        x = -1,
        label = biblical_book,
        fontface = if_else(emphasis == "context", "plain", "bold"),
        color = accent_color
      ),
      hjust = 1,
      family = fonts$text,
      size = 3.6,
      show.legend = FALSE
    ) +
    scale_color_identity() +
    scale_size_manual(
      values = c(hero = 5, continuity = 3.6, context = 2.8),
      guide = "none"
    ) +
    shared_x +
    labs(title = panel_title) +
    theme(
      ## Panel headings stay small and muted — the hierarchy belongs to
      ## Genesis/1 Enoch, not to the panel titles.
      plot.title = element_textbox_simple(
        size = rel(0.85), face = "bold", family = fonts$title_1,
        color = "gray20", margin = margin(b = 10)
      )
    )
}

### |-  plot ----
p1 <- build_panel(panel1_data, "Familiar biblical books")
p2 <- build_panel(panel2_data, "Add other works in the catalog")

p <- (p1 | p2) +
  plot_annotation(
    title = title_text,
    subtitle = subtitle_text,
    caption = caption_text,
    theme = weekly_theme
  )
```

7. Save

Show code
```{r}
#| label: save
#| warning: false

### |- save ----
main_path  <- here::here("data_visualizations", "TidyTuesday", "2026", "tt_2026_37.png")
thumb_path <- here::here("data_visualizations", "TidyTuesday", "2026", "thumbnails", "tt_2026_37.png")

# Full-size version, for the QMD figure
save_ggplot(
  plot = p,
  file = main_path,
  width = 12,
  height = 6.5,
  units = "in",
  dpi = 300,
  create.dir = TRUE
)

# Reduced-size thumbnail, for the YAML `image:` field
fs::dir_create(dirname(thumb_path))
magick::image_read(main_path) |>
  magick::image_resize("400") |>
  magick::image_write(thumb_path)
```

8. Session Info

TipExpand for Session Info
R version 4.6.1 (2026-06-24)
Platform: aarch64-apple-darwin23
Running under: macOS Tahoe 26.6.2

Matrix products: default
BLAS:   /Library/Frameworks/R.framework/Versions/4.6/Resources/lib/libRblas.0.dylib 
LAPACK: /Library/Frameworks/R.framework/Versions/4.6/Resources/lib/libRlapack.dylib;  LAPACK version 3.12.1

locale:
[1] en_US.UTF-8/en_US.UTF-8/en_US.UTF-8/C/en_US.UTF-8/en_US.UTF-8

time zone: America/New_York
tzcode source: internal

attached base packages:
[1] stats     graphics  grDevices utils     datasets  methods   base     

other attached packages:
 [1] here_1.0.2      patchwork_1.3.2 ggview_0.2.2    skimr_2.2.2    
 [5] glue_1.8.1      scales_1.4.0    ggrepel_0.9.8   janitor_2.2.1  
 [9] showtext_0.9-8  showtextdb_3.0  sysfonts_0.8.9  ggtext_0.1.2   
[13] lubridate_1.9.5 forcats_1.0.1   stringr_1.6.0   dplyr_1.2.1    
[17] purrr_1.2.2     readr_2.2.0     tidyr_1.3.2     tibble_3.3.1   
[21] ggplot2_4.0.3   tidyverse_2.0.0 pacman_0.5.1   

loaded via a namespace (and not attached):
 [1] gtable_0.3.6       xfun_0.60          httr2_1.3.0        htmlwidgets_1.6.4 
 [5] gh_1.6.1           tzdb_0.5.0         vctrs_0.7.3        tools_4.6.1       
 [9] generics_0.1.4     parallel_4.6.1     curl_7.1.0         pkgconfig_2.0.3   
[13] RColorBrewer_1.1-3 S7_0.2.2           lifecycle_1.0.5    compiler_4.6.1    
[17] farver_2.1.2       textshaping_1.0.5  repr_1.1.7         codetools_0.2-20  
[21] snakecase_0.11.1   litedown_0.10      htmltools_0.5.9    yaml_2.3.12       
[25] crayon_1.5.3       pillar_1.11.1      magick_2.9.1       commonmark_2.0.0  
[29] tidyselect_1.2.1   digest_0.6.39      stringi_1.8.7      rprojroot_2.1.1   
[33] fastmap_1.2.0      grid_4.6.1         cli_3.6.6          magrittr_2.0.5    
[37] base64enc_0.1-6    withr_3.0.3        bit64_4.8.2        timechange_0.4.0  
[41] rmarkdown_2.31     tidytuesdayR_1.3.2 gitcreds_0.1.2     bit_4.6.0         
[45] otel_0.2.0         ragg_1.5.2         hms_1.1.4          evaluate_1.0.5    
[49] knitr_1.51         markdown_2.0       rlang_1.3.0        gridtext_0.1.6    
[53] Rcpp_1.1.2         xml2_1.6.0         rstudioapi_0.19.0  vroom_1.7.1       
[57] jsonlite_2.0.0     R6_2.6.1           fs_2.1.0           systemfonts_1.3.2 

9. GitHub Repository

TipExpand for GitHub Repo

The complete code for this analysis is available in tt_2026_37.qmd.

For the full repository, click here.

10. References

TipExpand for References
  1. Data Source:
    • TidyTuesday 2026 Week 37: Dead Sea Scrolls Manuscripts

11. Custom Functions Documentation

Note📦 Custom Helper Functions

This analysis uses custom functions from my personal module library for efficiency and consistency across projects.

Functions Used:

  • fonts.R: setup_fonts(), get_font_families() - Font management with showtext
  • social_icons.R: create_social_caption() - Generates formatted social media captions
  • image_utils.R: save_plot() - Consistent plot saving with naming conventions
  • base_theme.R: create_base_theme(), extend_weekly_theme(), get_theme_colors() - Custom ggplot2 themes

Why custom functions?
These utilities standardize theming, fonts, and output across all my data visualizations. The core analysis (data tidying and visualization logic) uses only standard tidyverse packages.

Source Code:
View all custom functions → GitHub: R/utils

Back to top

Citation

BibTeX citation:
@online{ponce2026,
  author = {Ponce, Steven},
  title = {The Biblical Canon Tells Only Part of the Story},
  date = {2026-09-14},
  url = {https://stevenponce.netlify.app/data_visualizations/TidyTuesday/2026/tt_2026_37.html},
  langid = {en}
}
For attribution, please cite this work as:
Ponce, Steven. 2026. “The Biblical Canon Tells Only Part of the Story.” September 14. https://stevenponce.netlify.app/data_visualizations/TidyTuesday/2026/tt_2026_37.html.
Source Code
---
title: "The biblical canon tells only part of the story"
subtitle: "Among familiar biblical books, Genesis is one of the most frequently represented. The picture changes once other works in the catalog are included."
description: "A two-panel dot plot compares manuscript counts for works in the Dead Sea Scrolls catalog, moving from six familiar biblical books to the fuller set of works with at least 16 cataloged manuscripts. The reveal: 1 Enoch matches Genesis at 24 manuscripts each, outnumbering Exodus, Isaiah, and Leviticus. Built in R with ggplot2, ggtext, and patchwork."
date: "2026-09-14"
author:
  - name: "Steven Ponce"
    url: "https://stevenponce.netlify.app"
citation:
  url: "https://stevenponce.netlify.app/data_visualizations/TidyTuesday/2026/tt_2026_37.html"
categories: ["TidyTuesday", "Data Visualization", "R Programming", "2026"]
tags: [
  "TidyTuesday",
  "Dot Plot",
  "Two-Panel Chart",
  "patchwork",
  "Dead Sea Scrolls",
  "Biblical Studies",
  "Archaeology",
  "Ranking",
  "Data Storytelling",
  "Annotation",
  "R Programming",
  "ggplot2",
  "2026"
]
image: "thumbnails/tt_2026_37.png"
format:
  html:
    toc: true
    toc-depth: 5
    code-link: true
    code-fold: true
    code-tools: true
    code-summary: "Show code"
    self-contained: true
    theme: 
      light: [flatly, assets/styling/custom_styles.scss]
      dark: [darkly, assets/styling/custom_styles_dark.scss]
editor_options: 
  chunk_output_type: inline
execute: 
  freeze: true
  cache: true
  error: false
  message: false
  warning: false
  eval: true
---
![Two-panel dot plot of Dead Sea Scrolls manuscript counts (works with ≥16 manuscripts). Left panel: six familiar biblical books, Genesis at 24. Right panel adds other catalog works — 1 Enoch also totals 24, tying Genesis and exceeding Exodus, Isaiah, and Leviticus, showing the biblical canon captures only part of this collection's textual world.](tt_2026_37.png){#fig-1}

### [**Steps to Create this Graphic**]{.mark}

#### [1. Load Packages & Setup]{.smallcaps}

```{r}
#| label: load
#| warning: false
#| message: false      
#| results: "hide"     

## 1. LOAD PACKAGES & SETUP ----
suppressPackageStartupMessages({
if (!require("pacman")) install.packages("pacman")
pacman::p_load(
    tidyverse, ggtext, showtext, janitor, ggrepel,      
    scales, glue, skimr, ggview, patchwork
    )
})

# Source utility functions
suppressMessages(source(here::here("R/utils/fonts.R")))
source(here::here("R/utils/social_icons.R"))
source(here::here("R/utils/image_utils.R"))
source(here::here("R/themes/base_theme.R"))
```

#### [2. Read in the Data]{.smallcaps}

```{r}
#| label: read
#| include: true
#| eval: true
#| warning: false

## 2. READ IN THE DATA ----
tt <- tidytuesdayR::tt_load(2026, week = 37)
dead_sea_scrolls <- tt$dead_sea_scrolls
rm(tt)
```

#### [3. Examine the Data]{.smallcaps}

```{r}
#| label: examine
#| include: true
#| eval: true
#| results: 'hide'
#| warning: false

## 3. EXAMINING THE DATA ----
glimpse(dead_sea_scrolls)
skim_without_charts(dead_sea_scrolls)
```

#### [4. Tidy Data]{.smallcaps}

```{r}
#| label: tidy
#| warning: false

### |- standardized work counts ----
book_counts <- dead_sea_scrolls |>
  filter(!is.na(biblical_book)) |>
  count(biblical_book, canon_status, name = "n_manuscripts", sort = TRUE)

### |- hero cutoff ----
## Cut at n >= 16. Clean boundary — no tied works are split across it (the
## next cluster, n = 11, has four works tied together).
hero_set <- book_counts |>
  filter(n_manuscripts >= 16)
```

#### [5. Visualization Parameters]{.smallcaps}

```{r}
#| label: params
#| include: true
#| warning: false

### |- plot aesthetics ----
clrs <- get_theme_colors(
    palette = c("hero" = "#7B2D3E", "context" = "gray50")
)

### |- titles and caption ----
title_text <- str_glue("The biblical canon tells only part of the story")

subtitle_text <- str_glue(
    "Among familiar biblical books, **Genesis** is one of the most frequently ",
    "represented.<br>The picture changes once other works in the catalog are included."
)

caption_text <- create_social_caption(
    tt_year = 2026,
    tt_week = 37,
    source_text = "Israel Antiquities Authority, Leon Levy Dead Sea Scrolls Digital Library"
)
caption_text <- str_replace(
    caption_text,
    "Source:",
    "Works with \u226516 cataloged manuscripts shown \u2022 Source:"
)

### |- fonts ----
setup_fonts()
fonts <- get_font_families()

### |- plot theme ----
base_theme <- create_base_theme(clrs)

weekly_theme <- extend_weekly_theme(
  base_theme,
  theme(
    plot.title = element_textbox_simple(
      size = rel(1.6),
      face = "bold",
      family = fonts$title_1,
      color = clrs$title,
      lineheight = 1.1,
      margin = margin(b = 8)
    ),
    plot.subtitle = element_textbox_simple(
      size = rel(0.8), lineheight = 1.25,
      family = fonts$subtitle,
      color = clrs$subtitle,
      margin = margin(b = 20)
    ),
    plot.caption = element_textbox_simple(
      size = rel(0.55), lineheight = 1.15,
      family = fonts$caption,
      color = clrs$caption,
      margin = margin(t = 12)
    ),
    axis.text.y = element_blank(),
    axis.ticks.y = element_blank(),
    axis.text.x = element_text(family = fonts$text, size = rel(0.85), color = "gray60"),
    axis.title = element_blank(),
    panel.grid.major.y = element_blank(),
    panel.grid.major.x = element_line(color = "gray92", linewidth = 0.3),
    panel.grid.minor = element_blank(),
    axis.ticks.x = element_blank(),
    legend.position = "none",
    plot.margin = margin(t = 12, r = 20, b = 10, l = 10)
  )
)

theme_set(weekly_theme)
```

#### [6. Plot]{.smallcaps}

```{r}
#| label: plot
#| warning: false

### |- panel 1: familiar biblical books ----
panel1_data <- hero_set |>
  filter(canon_status == "Protocanonical") |>
  mutate(
    emphasis = if_else(biblical_book == "Genesis", "continuity", "context"),
    accent_color = clrs$palette[["context"]],
    biblical_book = fct_reorder(biblical_book, n_manuscripts)
  )

### |- panel 2: add other works in the catalog ----
panel2_data <- hero_set |>
  mutate(
    emphasis = if_else(biblical_book %in% c("Genesis", "1 Enoch"), "hero", "context"),
    accent_color = if_else(emphasis == "hero", clrs$palette[["hero"]], clrs$palette[["context"]]),
    biblical_book = fct_reorder(biblical_book, n_manuscripts)
  )

### |- shared x scale ----
shared_x <- list(
  scale_x_continuous(limits = c(-16, 38), breaks = seq(0, 30, 10))
)

### |- panel builder ----
build_panel <- function(data, panel_title) {
  ggplot(data, aes(x = n_manuscripts, y = biblical_book)) +
    geom_point(aes(color = accent_color, size = emphasis)) +
    geom_text(
      data = filter(data, emphasis == "hero"),
      aes(label = n_manuscripts),
      color = clrs$palette[["hero"]],
      fontface = "bold",
      family = fonts$text,
      size = 4.2,
      hjust = -0.9
    ) +
    geom_text(
      aes(
        x = -1,
        label = biblical_book,
        fontface = if_else(emphasis == "context", "plain", "bold"),
        color = accent_color
      ),
      hjust = 1,
      family = fonts$text,
      size = 3.6,
      show.legend = FALSE
    ) +
    scale_color_identity() +
    scale_size_manual(
      values = c(hero = 5, continuity = 3.6, context = 2.8),
      guide = "none"
    ) +
    shared_x +
    labs(title = panel_title) +
    theme(
      ## Panel headings stay small and muted — the hierarchy belongs to
      ## Genesis/1 Enoch, not to the panel titles.
      plot.title = element_textbox_simple(
        size = rel(0.85), face = "bold", family = fonts$title_1,
        color = "gray20", margin = margin(b = 10)
      )
    )
}

### |-  plot ----
p1 <- build_panel(panel1_data, "Familiar biblical books")
p2 <- build_panel(panel2_data, "Add other works in the catalog")

p <- (p1 | p2) +
  plot_annotation(
    title = title_text,
    subtitle = subtitle_text,
    caption = caption_text,
    theme = weekly_theme
  )
```

### [7. Save]{.smallcaps}

```{r}
#| label: save
#| warning: false

### |- save ----
main_path  <- here::here("data_visualizations", "TidyTuesday", "2026", "tt_2026_37.png")
thumb_path <- here::here("data_visualizations", "TidyTuesday", "2026", "thumbnails", "tt_2026_37.png")

# Full-size version, for the QMD figure
save_ggplot(
  plot = p,
  file = main_path,
  width = 12,
  height = 6.5,
  units = "in",
  dpi = 300,
  create.dir = TRUE
)

# Reduced-size thumbnail, for the YAML `image:` field
fs::dir_create(dirname(thumb_path))
magick::image_read(main_path) |>
  magick::image_resize("400") |>
  magick::image_write(thumb_path)
```


#### [8. Session Info]{.smallcaps}

::: {.callout-tip collapse="true"}
##### Expand for Session Info

```{r, echo = FALSE}
#| eval: true
#| warning: false

sessionInfo()
```
:::

#### [9. GitHub Repository]{.smallcaps}

::: {.callout-tip collapse="true"}
##### Expand for GitHub Repo

The complete code for this analysis is available in [`tt_2026_37.qmd`](https://github.com/poncest/personal-website/blob/master/data_visualizations/TidyTuesday/2026/tt_2026_37.qmd).

For the full repository, [click here](https://github.com/poncest/personal-website/).
:::

#### [10. References]{.smallcaps}

::: {.callout-tip collapse="true"}
##### Expand for References
1.  **Data Source:**
    -   TidyTuesday 2026 Week 37: [Dead Sea Scrolls Manuscripts](https://github.com/rfordatascience/tidytuesday/blob/main/data/2026/2026-09-15/readme.md)

:::


#### [11. Custom Functions Documentation]{.smallcaps}

::: {.callout-note collapse="true"}
##### 📦 Custom Helper Functions

This analysis uses custom functions from my personal module library for efficiency and consistency across projects.

**Functions Used:**

-   **`fonts.R`**: `setup_fonts()`, `get_font_families()` - Font management with showtext
-   **`social_icons.R`**: `create_social_caption()` - Generates formatted social media captions
-   **`image_utils.R`**: `save_plot()` - Consistent plot saving with naming conventions
-   **`base_theme.R`**: `create_base_theme()`, `extend_weekly_theme()`, `get_theme_colors()` - Custom ggplot2 themes

**Why custom functions?**\
These utilities standardize theming, fonts, and output across all my data visualizations. The core analysis (data tidying and visualization logic) uses only standard tidyverse packages.

**Source Code:**\
View all custom functions → [GitHub: R/utils](https://github.com/poncest/personal-website/tree/master/R)
:::

© 2024 Steven Ponce

Source Issues