• Steven Ponce
  • About
  • Data Visualizations
  • Behind the Viz
  • Projects
  • Resume
  • Email

On this page

  • Steps to Create this Graphic
    • 1. Load Packages & Setup
    • 2. Read in the Data
    • 3. Examine the Data
    • 4. Tidy Data
    • 5. Visualization Parameters
    • 6. Plot
  • 7. Save
    • 8. Session Info
    • 9. GitHub Repository
    • 10. References
    • 11. Custom Functions Documentation

23 of 27 tested avocado-oil products failed authenticity testing in both tested lots

  • Show All Code
  • Hide All Code

  • View Source

Researchers tested two separately purchased lots of each of 27 products labeled as made with avocado oil

TidyTuesday
Data Visualization
R Programming
2026
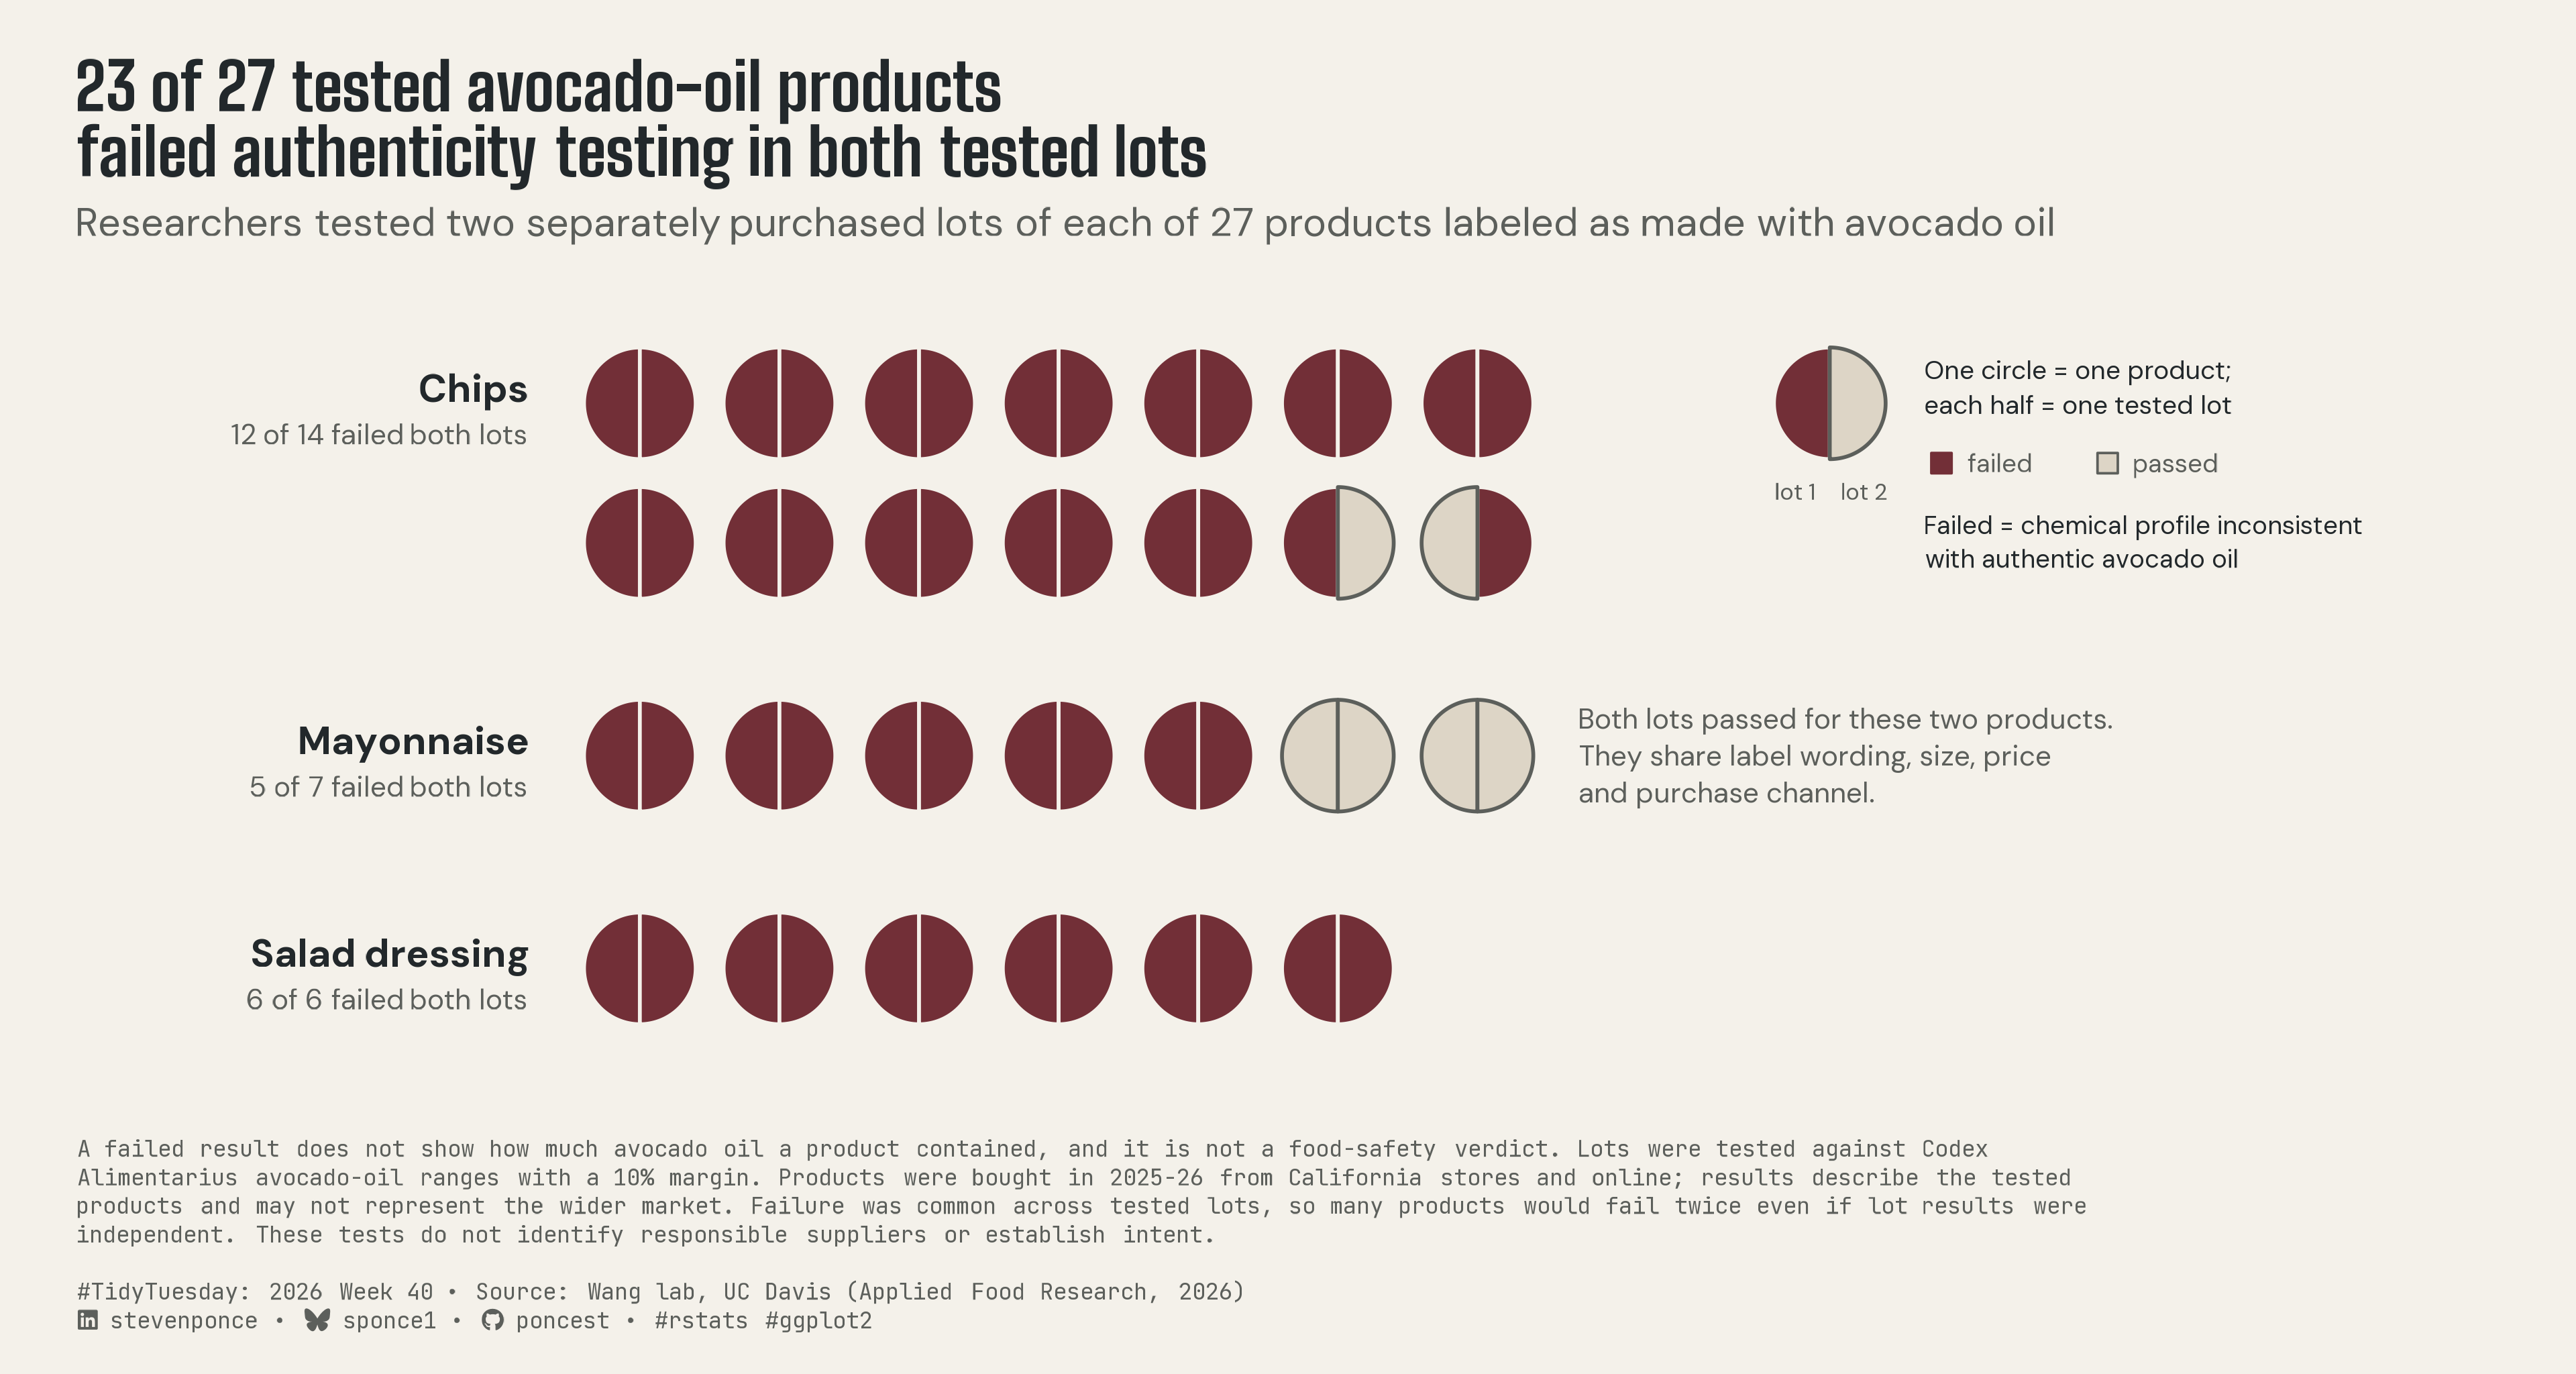
A split-circle unit chart shows that 23 of 27 tested avocado-oil products failed authenticity testing in both of their separately purchased lots. Each product’s two lots are shown side by side and grouped by chips, mayonnaise and salad dressing, with failure defined against Codex fatty-acid and sterol ranges. Built in R with ggplot2, ggforce and ggtext.
Author

Steven Ponce

Published

October 6, 2026

Figure 1: Unit chart titled 23 of 27 tested avocado-oil products failed authenticity testing in both tested lots. Each circle is one product, split into two halves for its two separately purchased lots; burgundy halves failed and outlined beige halves passed, where failure means a fatty-acid and sterol profile inconsistent with authentic avocado oil. Chips: 12 of 14 failed both lots, and two had one failing lot each. Mayonnaise: 5 of 7 failed both; two products passed both lots and share label wording, size, price, and purchase channel. Salad dressing: all 6 failed both. A caption notes that the results do not show how much avocado oil was present, are not a food-safety verdict, describe only the tested products, and do not identify responsible suppliers. Data: Wang Lab, UC Davis.

Steps to Create this Graphic

1. Load Packages & Setup

Show code
```{r}
#| label: load
#| warning: false
#| message: false      
#| results: "hide"     

## 1. LOAD PACKAGES & SETUP ----
suppressPackageStartupMessages({
if (!require("pacman")) install.packages("pacman")
pacman::p_load(
    tidyverse, ggtext, showtext, janitor, ggrepel,      
    scales, glue, skimr, ggview, ggforce
    )
})

# Source utility functions
suppressMessages(source(here::here("R/utils/fonts.R")))
source(here::here("R/utils/social_icons.R"))
source(here::here("R/utils/image_utils.R"))
source(here::here("R/themes/base_theme.R"))
```

2. Read in the Data

Show code
```{r}
#| label: read
#| include: true
#| eval: true
#| warning: false

### |- figure settings ----
fig_w <- 12
fig_h <- 6.4

## 2. READ IN THE DATA ----
tt <- tidytuesdayR::tt_load(2026, week = 40)
foods_raw <- tt$avocado_oil_processed_foods |> clean_names()
rm(tt)
```

3. Examine the Data

Show code
```{r}
#| label: examine
#| include: true
#| eval: true
#| results: 'hide'
#| warning: false

## 3. EXAMINING THE DATA ----
glimpse(foods_raw)
foods_raw |> count(oil_type, category, authentic)
```

4. Tidy Data

Show code
```{r}
#| label: tidy
#| warning: false

### |- product-level outcomes (avocado only; 2 lots per product) ----
lots <- foods_raw |>
    filter(oil_type == "avocado") |>
    select(product_id, lot, category, authentic, front_label,
           package_size_oz, retail_price_usd, purchase_location)

products <- lots |>
    select(product_id, category, lot, authentic) |>
    ungroup() |>
    pivot_wider(names_from = lot, values_from = authentic, names_prefix = "lot_") |>
    mutate(
        n_failed = (!lot_1) + (!lot_2),
        outcome = case_when(
            n_failed == 2 ~ "both_fail",
            n_failed == 1 ~ "split",
            TRUE          ~ "both_pass"
        ),
        outcome  = factor(outcome, levels = c("both_fail", "split", "both_pass")),
        category = factor(
            category,
            levels = c("chips", "mayonnaise", "salad_dressing"),
            labels = c("Chips", "Mayonnaise", "Salad dressing")
        )
    )

### |- computed facts + guards (every reader-facing number) ----
n_products  <- nrow(products)
n_both_fail <- sum(products$outcome == "both_fail")
n_split     <- sum(products$outcome == "split")
n_both_pass <- sum(products$outcome == "both_pass")

# independence benchmark: lot-specific failure rates
p_fail_lot1 <- mean(!products$lot_1)
p_fail_lot2 <- mean(!products$lot_2)
expected_both_fail <- n_products * p_fail_lot1 * p_fail_lot2

# the two passing products must all be mayonnaise with shared attributes
passing_ids <- products |> filter(outcome == "both_pass") |> pull(product_id)
passing_attrs <- lots |>
    filter(product_id %in% passing_ids) |>
    distinct(category, front_label, package_size_oz, retail_price_usd, purchase_location)

# spelled-out count for caption copy (matches on-chart "Two mayonnaise products")
n_both_pass_word <- c("one", "two", "three")[n_both_pass]

### |- coin layout: 7 coins per row, rows stacked by category ----
coins_per_row <- 7
coin_r        <- 0.42
row_gap       <- 1.05
cat_gap       <- 0.55

coins <- products |>
    arrange(category, outcome, product_id) |>
    mutate(
        idx = row_number() - 1,
        col = idx %% coins_per_row,
        row = idx %/% coins_per_row,
        .by = category
    )

cat_layout <- coins |>
    summarise(n_rows = max(row) + 1, n = n(),
              n_fail_both = sum(outcome == "both_fail"), .by = category) |>
    arrange(category) |>
    mutate(
        row_offset = lag(cumsum(n_rows), default = 0),
        cat_index  = row_number() - 1
    )

coins <- coins |>
    left_join(cat_layout |> select(category, row_offset, cat_index), by = "category") |>
    mutate(
        x0 = col * row_gap,
        y0 = -(row_offset + row) * row_gap - cat_index * cat_gap
    )

### |- one row per half-coin (lot 1 = left half, lot 2 = right half) ----
halves <- coins |>
    select(product_id, category, outcome, x0, y0, lot_1, lot_2) |>
    pivot_longer(c(lot_1, lot_2), names_to = "lot", values_to = "passed") |>
    mutate(
        start    = if_else(lot == "lot_1", pi, 0),
        end      = if_else(lot == "lot_1", 2 * pi, pi),
        fill_hex = if_else(passed, "#ddd5c6", "#722F37"),
        line_hex = if_else(passed, "#5c5f5b", "#f4f1ea")
    )

### |- category labels ----
cat_labels <- cat_layout |>
    left_join(coins |> filter(row == 0, col == 0) |> select(category, y0), by = "category") |>
    mutate(
        label = glue(
            "<b style='color:#22282b;font-size:13pt'>{category}</b><br>",
            "<span style='color:#5c5f5b;font-size:9.5pt'>{n_fail_both} of {n} failed both lots</span>"
        )
    )

### |- mayo annotation anchor (right of the last passing coin) ----
mayo_anchor <- coins |>
    filter(outcome == "both_pass") |>
    summarise(x = max(x0), y = mean(y0))

### |- key coin (top right) ----
key_x <- coins_per_row * row_gap + 1.6
key_y <- max(coins$y0)
key_halves <- tibble(
    x0 = key_x, y0 = key_y,
    start    = c(pi, 0),
    end      = c(2 * pi, pi),
    fill_hex = c("#722F37", "#ddd5c6"),
    line_hex = c("#f4f1ea", "#5c5f5b")
)
```

5. Visualization Parameters

Show code
```{r}
#| label: params
#| include: true
#| warning: false

### |-  plot aesthetics ----
clrs <- get_theme_colors(
    palette = list(
        failed   = "#722F37",
        passed   = "#ddd5c6",
        outline  = "#5c5f5b",
        paper    = "#f4f1ea",
        ink      = "#22282b",
        ink_soft = "#5c5f5b"
    )
)

### |- titles and caption ----
title_text <- glue(
    "{n_both_fail} of {n_products} tested avocado-oil products<br>",
    "failed authenticity testing in both tested lots"
)

subtitle_text <- glue(
    "Researchers tested two separately purchased lots of each of {n_products} ",
    "products labeled as made with avocado oil"
)

note_text <- glue(
    "A failed result does not show how much avocado oil a product contained, and it ",
    "is not a food-safety verdict. Lots were tested against Codex Alimentarius ",
    "avocado-oil ranges with a 10% margin. Products were bought in 2025-26 from ",
    "California stores and online; results describe the tested products and may not ",
    "represent the wider market. Failure was common across tested lots, so many ",
    "products would fail twice even if lot results were independent. These tests do ",
    "not identify responsible suppliers or establish intent."
) |>
    str_wrap(width = 150) |>
    str_replace_all("\n", "<br>")

caption_text <- glue(
    "{note_text}<br><br>",
    "{create_social_caption(tt_year = 2026, tt_week = 40, ",
    "source_text = 'Wang lab, UC Davis (Applied Food Research, 2026)')}"
)

### |-  fonts ----
setup_fonts()
fonts <- get_font_families()

### |-  plot theme ----
base_theme <- create_base_theme(clrs)

weekly_theme <- extend_weekly_theme(
    base_theme,
    theme(
        plot.background  = element_rect(fill = "#f4f1ea", color = "#f4f1ea"),
        panel.background = element_rect(fill = "#f4f1ea", color = "#f4f1ea"),
        panel.grid       = element_blank(),
        axis.text        = element_blank(),
        axis.title       = element_blank(),
        axis.ticks       = element_blank(),
        plot.title = element_markdown(
            family = fonts$title_1, face = "bold", size = rel(1.55),
            color = "#22282b", margin = margin(b = 6)
        ),
        plot.subtitle = element_markdown(
            family = fonts$subtitle, size = rel(0.95), color = "#5c5f5b",
            lineheight = 1.2, margin = margin(b = 14)
        ),
        plot.caption = element_markdown(
            family = fonts$caption, size = rel(0.55), color = "#5c5f5b",
            hjust = 0, lineheight = 1.25, margin = margin(t = 14)
        ),
        plot.title.position   = "plot",
        plot.caption.position = "plot",
        plot.margin = margin(t = 20, r = 22, b = 14, l = 22)
    )
)

theme_set(weekly_theme)
```

6. Plot

Show code
```{r}
#| label: plot
#| warning: false

### |-  main plot ----
p <- ggplot() +
    geom_arc_bar(
        data = halves,
        aes(x0 = x0, y0 = y0, r0 = 0, r = coin_r, start = start, end = end,
            fill = fill_hex, color = line_hex),
        linewidth = 0.6
    ) +
    geom_richtext(
        data = cat_labels,
        aes(x = -0.75, y = y0, label = label),
        hjust = 1, vjust = 0.6, family = fonts$text,
        fill = NA, label.color = NA, lineheight = 1.3
    ) +
    annotate(
        "text",
        x = mayo_anchor$x + coin_r + 0.35, y = mayo_anchor$y,
        label = "Both lots passed for these two products.\nThey share label wording, size, price\nand purchase channel.",
        hjust = 0, vjust = 0.5, family = fonts$text, size = 3.3,
        color = "#5c5f5b", lineheight = 1.1
    ) +
    geom_arc_bar(
        data = key_halves,
        aes(x0 = x0, y0 = y0, r0 = 0, r = coin_r, start = start, end = end,
            fill = fill_hex, color = line_hex),
        linewidth = 0.6
    ) +
    annotate(
        "text",
        x = key_x + c(-coin_r * 0.62, coin_r * 0.62), y = key_y - coin_r - 0.18,
        label = c("lot 1", "lot 2"),
        family = fonts$text, size = 2.8, color = "#5c5f5b", vjust = 1
    ) +
    annotate(
        "text",
        x = key_x + coin_r + 0.3, y = key_y + 0.12,
        label = "One circle = one product;\neach half = one tested lot",
        hjust = 0, vjust = 0.5, family = fonts$text, size = 3.1,
        color = "#22282b", lineheight = 1.1
    ) +
    annotate(
        "point",
        x = key_x + coin_r + 0.42 + c(0, 1.25), y = key_y - 0.45,
        shape = 22, size = 3.2, stroke = 0.6,
        fill = c("#722F37", "#ddd5c6"), color = c("#722F37", "#5c5f5b")
    ) +
    annotate(
        "text",
        x = key_x + coin_r + 0.62 + c(0, 1.25), y = key_y - 0.45,
        label = c("failed", "passed"),
        hjust = 0, vjust = 0.5, family = fonts$text, size = 3,
        color = "#5c5f5b"
    ) +
    annotate(
        "text",
        x = key_x + coin_r + 0.3, y = key_y - 0.85,
        label = "Failed = chemical profile inconsistent\nwith authentic avocado oil",
        hjust = 0, vjust = 1, family = fonts$text, size = 3,
        color = "#22282b", lineheight = 1.1
    ) +
    scale_fill_identity() +
    scale_color_identity() +
    coord_equal(
        xlim = c(-3.4, key_x + 4.2),
        ylim = c(min(coins$y0) - 0.7, max(coins$y0) + 0.6),
        clip = "off"
    ) +
    labs(title = title_text, subtitle = subtitle_text, caption = caption_text)
```

7. Save

Show code
```{r}
#| label: save
#| warning: false

### |- save ----
main_path  <- here::here("data_visualizations", "TidyTuesday", "2026", "tt_2026_40.png")
thumb_path <- here::here("data_visualizations", "TidyTuesday", "2026", "thumbnails", "tt_2026_40.png")

# Full-size version, for the QMD figure
ggview::save_ggplot(
    plot   = p,
    file   = main_path,
    width  = fig_w,
    height = fig_h,
    units  = "in",
    dpi    = 320
)

# Reduced-size thumbnail, for the YAML `image:` field
fs::dir_create(dirname(thumb_path))
magick::image_read(main_path) |>
  magick::image_resize("400") |>
  magick::image_write(thumb_path)
```

8. Session Info

TipExpand for Session Info
R version 4.6.1 (2026-06-24)
Platform: aarch64-apple-darwin23
Running under: macOS Tahoe 26.6.2

Matrix products: default
BLAS:   /Library/Frameworks/R.framework/Versions/4.6/Resources/lib/libRblas.0.dylib 
LAPACK: /Library/Frameworks/R.framework/Versions/4.6/Resources/lib/libRlapack.dylib;  LAPACK version 3.12.1

locale:
[1] en_US.UTF-8/en_US.UTF-8/en_US.UTF-8/C/en_US.UTF-8/en_US.UTF-8

time zone: America/New_York
tzcode source: internal

attached base packages:
[1] stats     graphics  grDevices utils     datasets  methods   base     

other attached packages:
 [1] here_1.0.2      ggforce_0.5.0   ggview_0.2.2    skimr_2.2.2    
 [5] glue_1.8.1      scales_1.4.0    ggrepel_0.9.8   janitor_2.2.1  
 [9] showtext_0.9-8  showtextdb_3.0  sysfonts_0.8.9  ggtext_0.2.0   
[13] lubridate_1.9.5 forcats_1.0.1   stringr_1.6.0   dplyr_1.2.1    
[17] purrr_1.2.2     readr_2.2.0     tidyr_1.3.2     tibble_3.3.1   
[21] ggplot2_4.0.3   tidyverse_2.0.0 pacman_0.5.1   

loaded via a namespace (and not attached):
 [1] gtable_0.3.6       httr2_1.3.0        xfun_0.60          htmlwidgets_1.6.4 
 [5] gh_1.6.1           tzdb_0.5.0         vctrs_0.7.3        tools_4.6.1       
 [9] generics_0.1.4     parallel_4.6.1     curl_7.1.0         pkgconfig_2.0.3   
[13] RColorBrewer_1.1-3 S7_0.2.2           lifecycle_1.0.5    compiler_4.6.1    
[17] farver_2.1.2       textshaping_1.0.5  repr_1.1.7         codetools_0.2-20  
[21] snakecase_0.11.1   litedown_0.10      htmltools_0.5.9    yaml_2.3.12       
[25] crayon_1.5.3       pillar_1.11.1      MASS_7.3-65        magick_2.9.1      
[29] commonmark_2.0.0   tidyselect_1.2.1   digest_0.6.39      stringi_1.8.7     
[33] labeling_0.4.3     polyclip_1.10-7    rprojroot_2.1.1    fastmap_1.2.0     
[37] grid_4.6.1         cli_3.6.6          magrittr_2.0.5     base64enc_0.1-6   
[41] utf8_1.2.6         withr_3.0.3        bit64_4.8.2        timechange_0.4.0  
[45] rmarkdown_2.31     tidytuesdayR_1.3.2 gitcreds_0.1.2     bit_4.6.0         
[49] otel_0.2.0         ragg_1.5.2         hms_1.1.4          evaluate_1.0.5    
[53] knitr_1.51         markdown_2.0       rlang_1.3.0        gridtext_0.1.6    
[57] Rcpp_1.1.2         tweenr_2.0.3       xml2_1.6.0         vroom_1.7.1       
[61] rstudioapi_0.19.0  jsonlite_2.0.0     R6_2.6.1           fs_2.1.0          
[65] systemfonts_1.3.2 

9. GitHub Repository

TipExpand for GitHub Repo

The complete code for this analysis is available in tt_2026_40.qmd.

For the full repository, click here.

10. References

TipExpand for References
  1. Data Source:
    • TidyTuesday 2026 Week 40: Avocado Oil Authenticity

11. Custom Functions Documentation

Note📦 Custom Helper Functions

This analysis uses custom functions from my personal module library for efficiency and consistency across projects.

Functions Used:

  • fonts.R: setup_fonts(), get_font_families() - Font management with showtext
  • social_icons.R: create_social_caption() - Generates formatted social media captions
  • image_utils.R: save_plot() - Consistent plot saving with naming conventions
  • base_theme.R: create_base_theme(), extend_weekly_theme(), get_theme_colors() - Custom ggplot2 themes

Why custom functions?
These utilities standardize theming, fonts, and output across all my data visualizations. The core analysis (data tidying and visualization logic) uses only standard tidyverse packages.

Source Code:
View all custom functions → GitHub: R/utils

Back to top

Citation

BibTeX citation:
@online{ponce2026,
  author = {Ponce, Steven},
  title = {23 of 27 Tested Avocado-Oil Products Failed Authenticity
    Testing in Both Tested Lots},
  date = {2026-10-06},
  url = {https://stevenponce.netlify.app/data_visualizations/TidyTuesday/2026/tt_2026_40.html},
  langid = {en}
}
For attribution, please cite this work as:
Ponce, Steven. 2026. “23 of 27 Tested Avocado-Oil Products Failed Authenticity Testing in Both Tested Lots.” October 6. https://stevenponce.netlify.app/data_visualizations/TidyTuesday/2026/tt_2026_40.html.
Source Code
---
title: "23 of 27 tested avocado-oil products failed authenticity testing in both tested lots"
subtitle: "Researchers tested two separately purchased lots of each of 27 products labeled as made with avocado oil"
description: "A split-circle unit chart shows that 23 of 27 tested avocado-oil products failed authenticity testing in both of their separately purchased lots. Each product's two lots are shown side by side and grouped by chips, mayonnaise and salad dressing, with failure defined against Codex fatty-acid and sterol ranges. Built in R with ggplot2, ggforce and ggtext."
date: "2026-10-06"
author:
  - name: "Steven Ponce"
    url: "https://stevenponce.netlify.app"
citation:
  url: "https://stevenponce.netlify.app/data_visualizations/TidyTuesday/2026/tt_2026_40.html"
categories: ["TidyTuesday", "Data Visualization", "R Programming", "2026"]
tags: [
  "TidyTuesday",
  "Unit Chart",
  "Split Circles",
  "Paired Samples",
  "Avocado Oil",
  "Food Authenticity",
  "Food Science",
  "Codex Alimentarius",
  "Annotation",
  "Uncertainty Communication",
  "ggforce",
  "ggtext",
  "2026"
]
image: "thumbnails/tt_2026_40.png"
format:
  html:
    toc: true
    toc-depth: 5
    code-link: true
    code-fold: true
    code-tools: true
    code-summary: "Show code"
    self-contained: true
    theme: 
      light: [flatly, assets/styling/custom_styles.scss]
      dark: [darkly, assets/styling/custom_styles_dark.scss]
editor_options: 
  chunk_output_type: inline
execute: 
  freeze: true
  cache: true
  error: false
  message: false
  warning: false
  eval: true
---
![Unit chart titled 23 of 27 tested avocado-oil products failed authenticity testing in both tested lots. Each circle is one product, split into two halves for its two separately purchased lots; burgundy halves failed and outlined beige halves passed, where failure means a fatty-acid and sterol profile inconsistent with authentic avocado oil. Chips: 12 of 14 failed both lots, and two had one failing lot each. Mayonnaise: 5 of 7 failed both; two products passed both lots and share label wording, size, price, and purchase channel. Salad dressing: all 6 failed both. A caption notes that the results do not show how much avocado oil was present, are not a food-safety verdict, describe only the tested products, and do not identify responsible suppliers. Data: Wang Lab, UC Davis.](tt_2026_40.png){#fig-1}

### [**Steps to Create this Graphic**]{.mark}

#### [1. Load Packages & Setup]{.smallcaps}

```{r}
#| label: load
#| warning: false
#| message: false      
#| results: "hide"     

## 1. LOAD PACKAGES & SETUP ----
suppressPackageStartupMessages({
if (!require("pacman")) install.packages("pacman")
pacman::p_load(
    tidyverse, ggtext, showtext, janitor, ggrepel,      
    scales, glue, skimr, ggview, ggforce
    )
})

# Source utility functions
suppressMessages(source(here::here("R/utils/fonts.R")))
source(here::here("R/utils/social_icons.R"))
source(here::here("R/utils/image_utils.R"))
source(here::here("R/themes/base_theme.R"))
```

#### [2. Read in the Data]{.smallcaps}

```{r}
#| label: read
#| include: true
#| eval: true
#| warning: false

### |- figure settings ----
fig_w <- 12
fig_h <- 6.4

## 2. READ IN THE DATA ----
tt <- tidytuesdayR::tt_load(2026, week = 40)
foods_raw <- tt$avocado_oil_processed_foods |> clean_names()
rm(tt)

```

#### [3. Examine the Data]{.smallcaps}

```{r}
#| label: examine
#| include: true
#| eval: true
#| results: 'hide'
#| warning: false

## 3. EXAMINING THE DATA ----
glimpse(foods_raw)
foods_raw |> count(oil_type, category, authentic)
```

#### [4. Tidy Data]{.smallcaps}

```{r}
#| label: tidy
#| warning: false

### |- product-level outcomes (avocado only; 2 lots per product) ----
lots <- foods_raw |>
    filter(oil_type == "avocado") |>
    select(product_id, lot, category, authentic, front_label,
           package_size_oz, retail_price_usd, purchase_location)

products <- lots |>
    select(product_id, category, lot, authentic) |>
    ungroup() |>
    pivot_wider(names_from = lot, values_from = authentic, names_prefix = "lot_") |>
    mutate(
        n_failed = (!lot_1) + (!lot_2),
        outcome = case_when(
            n_failed == 2 ~ "both_fail",
            n_failed == 1 ~ "split",
            TRUE          ~ "both_pass"
        ),
        outcome  = factor(outcome, levels = c("both_fail", "split", "both_pass")),
        category = factor(
            category,
            levels = c("chips", "mayonnaise", "salad_dressing"),
            labels = c("Chips", "Mayonnaise", "Salad dressing")
        )
    )

### |- computed facts + guards (every reader-facing number) ----
n_products  <- nrow(products)
n_both_fail <- sum(products$outcome == "both_fail")
n_split     <- sum(products$outcome == "split")
n_both_pass <- sum(products$outcome == "both_pass")

# independence benchmark: lot-specific failure rates
p_fail_lot1 <- mean(!products$lot_1)
p_fail_lot2 <- mean(!products$lot_2)
expected_both_fail <- n_products * p_fail_lot1 * p_fail_lot2

# the two passing products must all be mayonnaise with shared attributes
passing_ids <- products |> filter(outcome == "both_pass") |> pull(product_id)
passing_attrs <- lots |>
    filter(product_id %in% passing_ids) |>
    distinct(category, front_label, package_size_oz, retail_price_usd, purchase_location)

# spelled-out count for caption copy (matches on-chart "Two mayonnaise products")
n_both_pass_word <- c("one", "two", "three")[n_both_pass]

### |- coin layout: 7 coins per row, rows stacked by category ----
coins_per_row <- 7
coin_r        <- 0.42
row_gap       <- 1.05
cat_gap       <- 0.55

coins <- products |>
    arrange(category, outcome, product_id) |>
    mutate(
        idx = row_number() - 1,
        col = idx %% coins_per_row,
        row = idx %/% coins_per_row,
        .by = category
    )

cat_layout <- coins |>
    summarise(n_rows = max(row) + 1, n = n(),
              n_fail_both = sum(outcome == "both_fail"), .by = category) |>
    arrange(category) |>
    mutate(
        row_offset = lag(cumsum(n_rows), default = 0),
        cat_index  = row_number() - 1
    )

coins <- coins |>
    left_join(cat_layout |> select(category, row_offset, cat_index), by = "category") |>
    mutate(
        x0 = col * row_gap,
        y0 = -(row_offset + row) * row_gap - cat_index * cat_gap
    )

### |- one row per half-coin (lot 1 = left half, lot 2 = right half) ----
halves <- coins |>
    select(product_id, category, outcome, x0, y0, lot_1, lot_2) |>
    pivot_longer(c(lot_1, lot_2), names_to = "lot", values_to = "passed") |>
    mutate(
        start    = if_else(lot == "lot_1", pi, 0),
        end      = if_else(lot == "lot_1", 2 * pi, pi),
        fill_hex = if_else(passed, "#ddd5c6", "#722F37"),
        line_hex = if_else(passed, "#5c5f5b", "#f4f1ea")
    )

### |- category labels ----
cat_labels <- cat_layout |>
    left_join(coins |> filter(row == 0, col == 0) |> select(category, y0), by = "category") |>
    mutate(
        label = glue(
            "<b style='color:#22282b;font-size:13pt'>{category}</b><br>",
            "<span style='color:#5c5f5b;font-size:9.5pt'>{n_fail_both} of {n} failed both lots</span>"
        )
    )

### |- mayo annotation anchor (right of the last passing coin) ----
mayo_anchor <- coins |>
    filter(outcome == "both_pass") |>
    summarise(x = max(x0), y = mean(y0))

### |- key coin (top right) ----
key_x <- coins_per_row * row_gap + 1.6
key_y <- max(coins$y0)
key_halves <- tibble(
    x0 = key_x, y0 = key_y,
    start    = c(pi, 0),
    end      = c(2 * pi, pi),
    fill_hex = c("#722F37", "#ddd5c6"),
    line_hex = c("#f4f1ea", "#5c5f5b")
)

```

#### [5. Visualization Parameters]{.smallcaps}

```{r}
#| label: params
#| include: true
#| warning: false

### |-  plot aesthetics ----
clrs <- get_theme_colors(
    palette = list(
        failed   = "#722F37",
        passed   = "#ddd5c6",
        outline  = "#5c5f5b",
        paper    = "#f4f1ea",
        ink      = "#22282b",
        ink_soft = "#5c5f5b"
    )
)

### |- titles and caption ----
title_text <- glue(
    "{n_both_fail} of {n_products} tested avocado-oil products<br>",
    "failed authenticity testing in both tested lots"
)

subtitle_text <- glue(
    "Researchers tested two separately purchased lots of each of {n_products} ",
    "products labeled as made with avocado oil"
)

note_text <- glue(
    "A failed result does not show how much avocado oil a product contained, and it ",
    "is not a food-safety verdict. Lots were tested against Codex Alimentarius ",
    "avocado-oil ranges with a 10% margin. Products were bought in 2025-26 from ",
    "California stores and online; results describe the tested products and may not ",
    "represent the wider market. Failure was common across tested lots, so many ",
    "products would fail twice even if lot results were independent. These tests do ",
    "not identify responsible suppliers or establish intent."
) |>
    str_wrap(width = 150) |>
    str_replace_all("\n", "<br>")

caption_text <- glue(
    "{note_text}<br><br>",
    "{create_social_caption(tt_year = 2026, tt_week = 40, ",
    "source_text = 'Wang lab, UC Davis (Applied Food Research, 2026)')}"
)

### |-  fonts ----
setup_fonts()
fonts <- get_font_families()

### |-  plot theme ----
base_theme <- create_base_theme(clrs)

weekly_theme <- extend_weekly_theme(
    base_theme,
    theme(
        plot.background  = element_rect(fill = "#f4f1ea", color = "#f4f1ea"),
        panel.background = element_rect(fill = "#f4f1ea", color = "#f4f1ea"),
        panel.grid       = element_blank(),
        axis.text        = element_blank(),
        axis.title       = element_blank(),
        axis.ticks       = element_blank(),
        plot.title = element_markdown(
            family = fonts$title_1, face = "bold", size = rel(1.55),
            color = "#22282b", margin = margin(b = 6)
        ),
        plot.subtitle = element_markdown(
            family = fonts$subtitle, size = rel(0.95), color = "#5c5f5b",
            lineheight = 1.2, margin = margin(b = 14)
        ),
        plot.caption = element_markdown(
            family = fonts$caption, size = rel(0.55), color = "#5c5f5b",
            hjust = 0, lineheight = 1.25, margin = margin(t = 14)
        ),
        plot.title.position   = "plot",
        plot.caption.position = "plot",
        plot.margin = margin(t = 20, r = 22, b = 14, l = 22)
    )
)

theme_set(weekly_theme)
```

#### [6. Plot]{.smallcaps}

```{r}
#| label: plot
#| warning: false

### |-  main plot ----
p <- ggplot() +
    geom_arc_bar(
        data = halves,
        aes(x0 = x0, y0 = y0, r0 = 0, r = coin_r, start = start, end = end,
            fill = fill_hex, color = line_hex),
        linewidth = 0.6
    ) +
    geom_richtext(
        data = cat_labels,
        aes(x = -0.75, y = y0, label = label),
        hjust = 1, vjust = 0.6, family = fonts$text,
        fill = NA, label.color = NA, lineheight = 1.3
    ) +
    annotate(
        "text",
        x = mayo_anchor$x + coin_r + 0.35, y = mayo_anchor$y,
        label = "Both lots passed for these two products.\nThey share label wording, size, price\nand purchase channel.",
        hjust = 0, vjust = 0.5, family = fonts$text, size = 3.3,
        color = "#5c5f5b", lineheight = 1.1
    ) +
    geom_arc_bar(
        data = key_halves,
        aes(x0 = x0, y0 = y0, r0 = 0, r = coin_r, start = start, end = end,
            fill = fill_hex, color = line_hex),
        linewidth = 0.6
    ) +
    annotate(
        "text",
        x = key_x + c(-coin_r * 0.62, coin_r * 0.62), y = key_y - coin_r - 0.18,
        label = c("lot 1", "lot 2"),
        family = fonts$text, size = 2.8, color = "#5c5f5b", vjust = 1
    ) +
    annotate(
        "text",
        x = key_x + coin_r + 0.3, y = key_y + 0.12,
        label = "One circle = one product;\neach half = one tested lot",
        hjust = 0, vjust = 0.5, family = fonts$text, size = 3.1,
        color = "#22282b", lineheight = 1.1
    ) +
    annotate(
        "point",
        x = key_x + coin_r + 0.42 + c(0, 1.25), y = key_y - 0.45,
        shape = 22, size = 3.2, stroke = 0.6,
        fill = c("#722F37", "#ddd5c6"), color = c("#722F37", "#5c5f5b")
    ) +
    annotate(
        "text",
        x = key_x + coin_r + 0.62 + c(0, 1.25), y = key_y - 0.45,
        label = c("failed", "passed"),
        hjust = 0, vjust = 0.5, family = fonts$text, size = 3,
        color = "#5c5f5b"
    ) +
    annotate(
        "text",
        x = key_x + coin_r + 0.3, y = key_y - 0.85,
        label = "Failed = chemical profile inconsistent\nwith authentic avocado oil",
        hjust = 0, vjust = 1, family = fonts$text, size = 3,
        color = "#22282b", lineheight = 1.1
    ) +
    scale_fill_identity() +
    scale_color_identity() +
    coord_equal(
        xlim = c(-3.4, key_x + 4.2),
        ylim = c(min(coins$y0) - 0.7, max(coins$y0) + 0.6),
        clip = "off"
    ) +
    labs(title = title_text, subtitle = subtitle_text, caption = caption_text)
```

### [7. Save]{.smallcaps}

```{r}
#| label: save
#| warning: false

### |- save ----
main_path  <- here::here("data_visualizations", "TidyTuesday", "2026", "tt_2026_40.png")
thumb_path <- here::here("data_visualizations", "TidyTuesday", "2026", "thumbnails", "tt_2026_40.png")

# Full-size version, for the QMD figure
ggview::save_ggplot(
    plot   = p,
    file   = main_path,
    width  = fig_w,
    height = fig_h,
    units  = "in",
    dpi    = 320
)

# Reduced-size thumbnail, for the YAML `image:` field
fs::dir_create(dirname(thumb_path))
magick::image_read(main_path) |>
  magick::image_resize("400") |>
  magick::image_write(thumb_path)
```


#### [8. Session Info]{.smallcaps}

::: {.callout-tip collapse="true"}
##### Expand for Session Info

```{r, echo = FALSE}
#| eval: true
#| warning: false

sessionInfo()
```
:::

#### [9. GitHub Repository]{.smallcaps}

::: {.callout-tip collapse="true"}
##### Expand for GitHub Repo

The complete code for this analysis is available in [`tt_2026_40.qmd`](https://github.com/poncest/personal-website/blob/master/data_visualizations/TidyTuesday/2026/tt_2026_40.qmd).

For the full repository, [click here](https://github.com/poncest/personal-website/).
:::

#### [10. References]{.smallcaps}

::: {.callout-tip collapse="true"}
##### Expand for References
1.  **Data Source:**
    -   TidyTuesday 2026 Week 40: [Avocado Oil Authenticity](https://github.com/rfordatascience/tidytuesday/blob/main/data/2026/2026-10-06/readme.md)

:::


#### [11. Custom Functions Documentation]{.smallcaps}

::: {.callout-note collapse="true"}
##### 📦 Custom Helper Functions

This analysis uses custom functions from my personal module library for efficiency and consistency across projects.

**Functions Used:**

-   **`fonts.R`**: `setup_fonts()`, `get_font_families()` - Font management with showtext
-   **`social_icons.R`**: `create_social_caption()` - Generates formatted social media captions
-   **`image_utils.R`**: `save_plot()` - Consistent plot saving with naming conventions
-   **`base_theme.R`**: `create_base_theme()`, `extend_weekly_theme()`, `get_theme_colors()` - Custom ggplot2 themes

**Why custom functions?**\
These utilities standardize theming, fonts, and output across all my data visualizations. The core analysis (data tidying and visualization logic) uses only standard tidyverse packages.

**Source Code:**\
View all custom functions → [GitHub: R/utils](https://github.com/poncest/personal-website/tree/master/R)
:::

© 2024 Steven Ponce

Source Issues