---
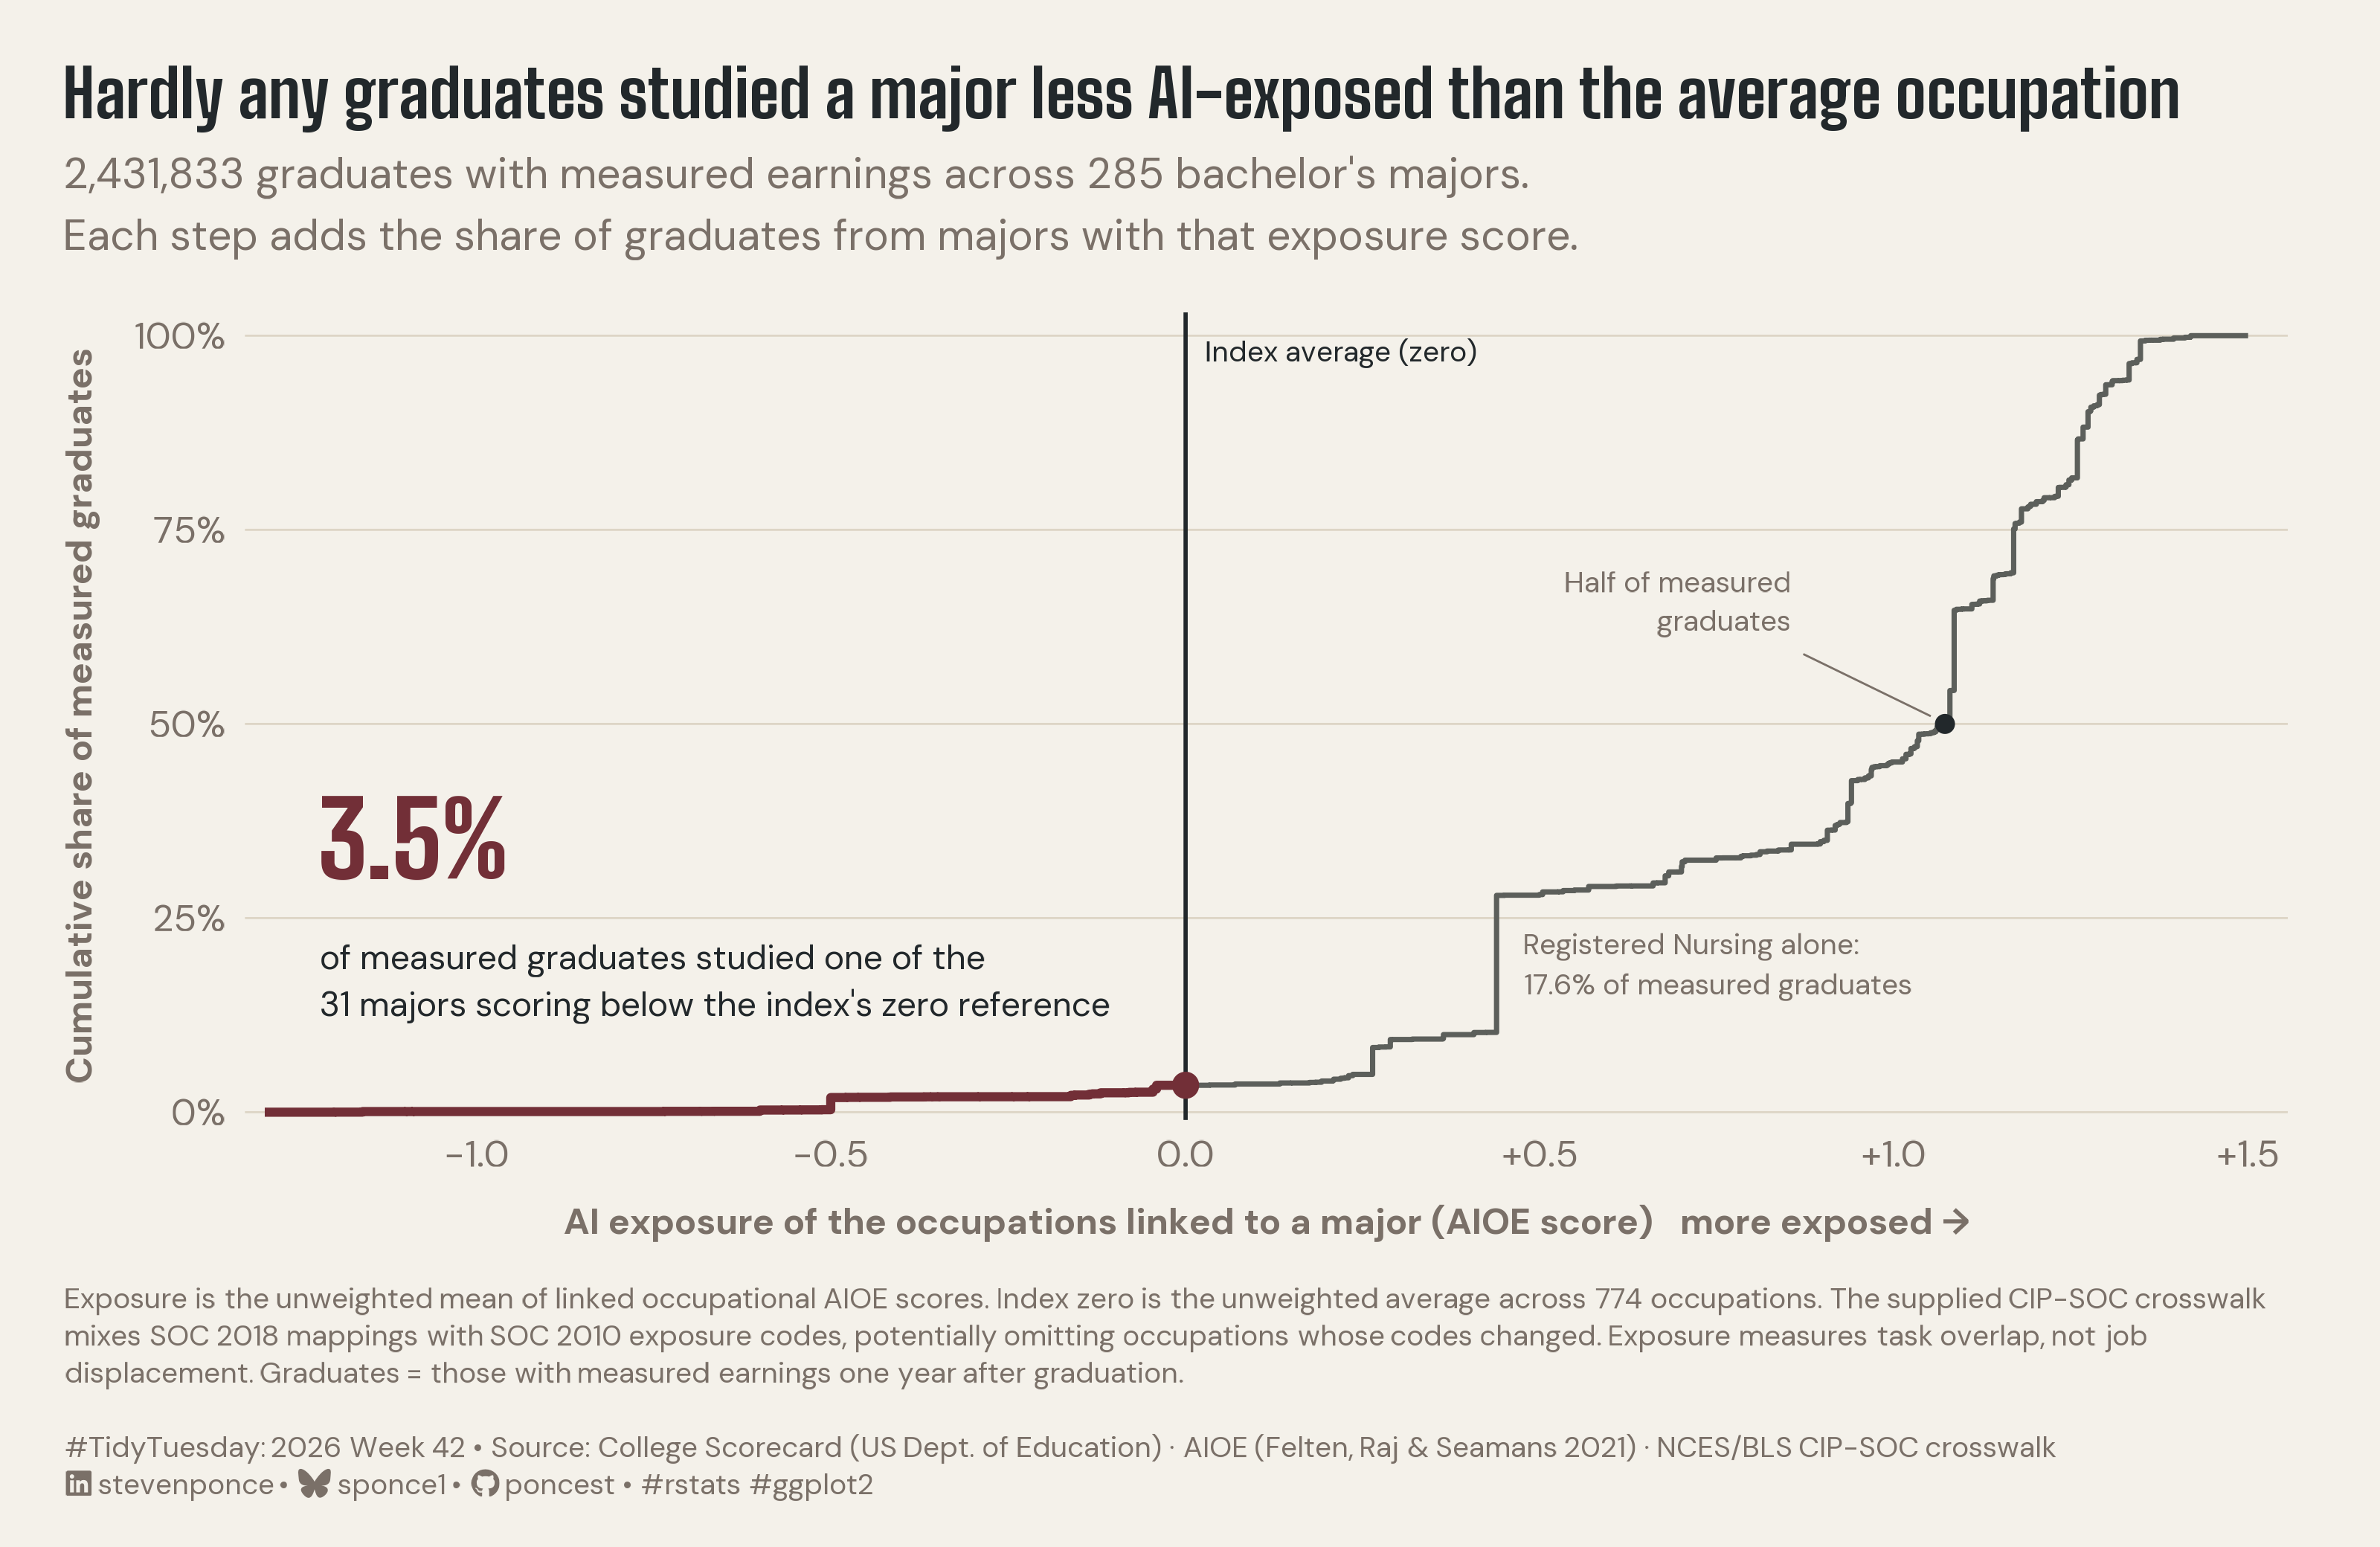
title: "Hardly any graduates studied a major less AI-exposed than the average occupation"
subtitle: "2,431,833 graduates with measured earnings across 285 bachelor's majors. Each step adds the share of graduates from majors with that exposure score."
description: "Only 3.5% of 2.43 million measured graduates studied a major less AI-exposed than the average occupation on the AIOE index. A graduate-weighted cumulative step curve replaces the original chart's percentile axis with the index's raw scale. Built in R with ggplot2, ggtext, showtext and ggview."
date: "2026-10-19"
author:
- name: "Steven Ponce"
url: "https://stevenponce.netlify.app"
citation:
url: "https://stevenponce.netlify.app/data_visualizations/TidyTuesday/2026/tt_2026_42.html"
categories: ["TidyTuesday", "2026"]
tags: [
"College Majors",
"AI Exposure",
"AIOE",
"College Scorecard",
"Higher Education",
"Labor Market",
"Cumulative Distribution",
"Step Chart",
"Weighted ECDF",
"Annotation",
"ggtext",
"showtext",
"ggview",
"2026"
]
image: "thumbnails/tt_2026_42.png"
format:
html:
toc: true
toc-depth: 5
code-link: true
code-fold: true
code-tools: true
code-summary: "Show code"
editor_options:
chunk_output_type: inline
execute:
freeze: true
cache: true
error: false
message: false
warning: false
eval: true
---
{#fig-1}
### [**Steps to Create this Graphic**]{.mark}
#### [1. Load Packages & Setup]{.smallcaps}
```{r}
#| label: load
#| warning: false
#| message: false
#| results: "hide"

## 1. LOAD PACKAGES & SETUP ----
suppressPackageStartupMessages({
if (!require("pacman")) install.packages("pacman")
pacman::p_load(
    tidyverse, ggtext, showtext, janitor, scales,
    glue, ggview, magick
    )
})

# Source utility functions
suppressMessages(source(here::here("R/utils/fonts.R")))
source(here::here("R/utils/social_icons.R"))
source(here::here("R/utils/image_utils.R"))
source(here::here("R/themes/base_theme.R"))
```
#### [2. Read in the Data]{.smallcaps}
```{r}
#| label: read
#| include: true
#| eval: true
#| warning: false

### |- figure settings ----
fig_w   <- 10
fig_h   <- 6.5
fig_dpi <- 320
out_file   <- "2026/Week_42/2026_42.png"

setup_fonts()
fonts <- get_font_families()
title_family <- fonts$title_1 %||% fonts$title
text_family  <- fonts$text


## 2. READ IN THE DATA ----
tt <- tidytuesdayR::tt_load(2026, week = 42)
majors_raw <- tt$ai_salary_majors |> clean_names()
rm(tt)
```
#### [3. Examine the Data]{.smallcaps}
```{r}
#| label: examine
#| include: true
#| eval: true
#| results: 'hide'
#| warning: false

## 3. EXAMINING THE DATA ----
glimpse(majors_raw)
skimr::skim(majors_raw)
```
#### [4. Tidy Data]{.smallcaps}
```{r}
#| label: tidy
#| warning: false

### |- majors ----
majors <- majors_raw |>
  mutate(is_rn = str_detect(field_of_study, "^Registered Nursing"))

### |- weighted ECDF: aggregate tied scores, then one step per distinct score ----
ecdf_df <- majors |>
  summarise(
    grads   = sum(n_graduates),
    n_maj   = n(),
    has_rn  = any(is_rn),
    .by     = ai_exposure
  ) |>
  arrange(ai_exposure) |>
  mutate(
    cum_share  = cumsum(grads) / sum(grads),
    prev_share = lag(cum_share, default = 0)
  )

x_min <- -1.3
x_max <- 1.5

step_df <- bind_rows(
  tibble(ai_exposure = x_min, cum_share = 0),
  ecdf_df |> select(ai_exposure, cum_share),
  tibble(ai_exposure = x_max, cum_share = 1)
) |>
  mutate(side = if_else(ai_exposure < 0, "below", "above"))

# Split the step path at zero so the left segment can carry the accent
share_at_zero <- max(ecdf_df$cum_share[ecdf_df$ai_exposure < 0])
step_below <- bind_rows(
  step_df |> filter(ai_exposure < 0),
  tibble(ai_exposure = 0, cum_share = share_at_zero)
)
step_above <- bind_rows(
  tibble(ai_exposure = 0, cum_share = share_at_zero),
  step_df |> filter(ai_exposure >= 0)
)

### |- reader-facing numbers (computed, guarded next to the copy they feed) ----
total_grads <- sum(majors$n_graduates)
n_majors <- nrow(majors)
n_below_zero <- sum(majors$ai_exposure < 0)
share_below <- sum(majors$n_graduates[majors$ai_exposure < 0]) / total_grads

rn_row <- ecdf_df |> filter(has_rn)
rn_exp <- rn_row$ai_exposure
rn_share <- majors$n_graduates[majors$is_rn] / total_grads

# Graduate-weighted median: first exposure score where cumulative share >= 50%
half_row <- ecdf_df |>
  filter(cum_share >= 0.5) |>
  slice_head(n = 1)
x_half <- half_row$ai_exposure

med_major <- median(majors$ai_exposure) # equal-weight median
```
#### [5. Visualization Parameters]{.smallcaps}
```{r}
#| label: params
#| include: true
#| warning: false

### |- plot aesthetics ----
colors <- get_theme_colors(
  palette = list(
    accent    = "#722F37",
    curve     = "#5c5f5b",
    ink       = "#22282b",
    muted     = "#7A7068",
    paper     = "#f4f1ea"
  )
)
clrs <- colors$palette
if (is.null(clrs$accent)) {
  clrs <- list(
    accent = "#722F37", curve = "#5c5f5b",
    ink = "#22282b", muted = "#7A7068", paper = "#f4f1ea"
  )
}
col_accent <- clrs$accent
col_curve <- clrs$curve
col_ink <- clrs$ink
col_muted <- clrs$muted
col_paper <- clrs$paper

### |- titles and caption ----
title_text <- "Hardly any graduates studied a major less AI-exposed than the average occupation"

subtitle_text <- str_glue(
  "{comma(total_grads)} graduates with measured earnings across {n_majors} bachelor's majors.\n",
  "Each step adds the share of graduates from majors with that exposure score."
)

# Provenance constant (not computed from this dataset): AIOE Data Appendix A
n_aioe_occupations <- 774

note_text <- paste(
  "Exposure is the unweighted mean of linked occupational AIOE scores.",
  glue("Index zero is the unweighted average across {n_aioe_occupations} occupations."),
  "The supplied CIP-SOC crosswalk mixes SOC 2018 mappings with SOC 2010 exposure codes,",
  "potentially omitting occupations whose codes changed.",
  "Exposure measures task overlap, not job displacement.",
  "Graduates = those with measured earnings one year after graduation.<br>"
)

caption_text <- create_social_caption(
  tt_year     = 2026,
  tt_week     = 42,
  source_text = "College Scorecard (US Dept. of Education) · AIOE (Felten, Raj & Seamans 2021) · NCES/BLS CIP-SOC crosswalk"
)
caption_full <- paste0(note_text, "<br>", caption_text)

### |- annotation text (built from guarded values) ----
lab_below_big <- percent(share_below, accuracy = 0.1)
lab_below_small <- glue("of measured graduates studied one of the\n{n_below_zero} majors scoring below the index's zero reference")
lab_rn <- glue("Registered Nursing alone:\n{percent(rn_share, accuracy = 0.1)} of measured graduates")
lab_half <- "Half of measured\ngraduates"
lab_zero <- "Index average (zero)"

### |- copy guards ----
all_copy <- c(title_text, subtitle_text, note_text, lab_below_small, lab_rn, lab_half, lab_zero)

### |- plot theme ----
base_theme <- create_base_theme(colors)

weekly_theme <- extend_weekly_theme(
  base_theme,
  theme(
    plot.background = element_rect(fill = col_paper, color = NA),
    panel.background = element_rect(fill = col_paper, color = NA),
    plot.title = element_text(
      family = title_family, face = "bold", size = rel(1.42),
      color = col_ink, lineheight = 1.05, margin = margin(b = 8)
    ),
    plot.subtitle = element_text(
      family = text_family, size = rel(0.92), color = col_muted,
      lineheight = 1.2, margin = margin(b = 16)
    ),
    plot.caption = element_textbox_simple(
      family = text_family, size = rel(0.62), color = col_muted,
      lineheight = 1.3, width = unit(1, "npc"), margin = margin(t = 14)
    ),
    plot.title.position = "plot",
    plot.caption.position = "plot",
    axis.title.x = element_text(
      family = text_family, color = col_muted,
      size = rel(0.85), margin = margin(t = 10)
    ),
    axis.title.y = element_text(
      family = text_family, color = col_muted,
      size = rel(0.85), margin = margin(r = 10)
    ),
    axis.text = element_text(family = text_family, color = col_muted, size = rel(0.8)),
    axis.ticks = element_blank(),
    panel.grid.major.y = element_line(color = "#ddd5c6", linewidth = 0.3),
    panel.grid.major.x = element_blank(),
    panel.grid.minor = element_blank(),
    legend.position = "none",
    plot.margin = margin(20, 28, 14, 20)
  )
)

theme_set(weekly_theme)
```
#### [6. Plot]{.smallcaps}
```{r}
#| label: plot
#| warning: false

### |- annotation positions ----
pos <- list(
  below_x = -1.22, below_big_y = 0.30, below_small_y = 0.215,
  below_pt_x = 0, below_pt_y = share_below,
  rn_x = rn_exp + 0.04, rn_y = (rn_row$prev_share + rn_row$cum_share) / 2, # right of its riser, below the plateau
  half_x = x_half, half_lab_x = x_half - 0.22, half_lab_y = 0.62,
  zero_lab_y = 0.98
)

### |-  main plot ----
p <- ggplot() +
  geom_vline(xintercept = 0, color = col_ink, linewidth = 0.6) +
  geom_step(
    data = step_above, aes(ai_exposure, cum_share),
    direction = "hv", color = col_curve, linewidth = 0.75
  ) +
  geom_step(
    data = step_below, aes(ai_exposure, cum_share),
    direction = "hv", color = col_accent, linewidth = 1.3
  ) +
  annotate("point",
    x = pos$below_pt_x, y = pos$below_pt_y,
    color = col_accent, size = 3
  ) +
  annotate("text",
    x = pos$below_x, y = pos$below_big_y, label = lab_below_big,
    family = title_family, fontface = "bold", size = 11,
    color = col_accent, hjust = 0, vjust = 0
  ) +
  annotate("text",
    x = pos$below_x, y = pos$below_small_y, label = lab_below_small,
    family = text_family, size = 3.6, color = col_ink,
    hjust = 0, vjust = 1, lineheight = 1.15
  ) +
  annotate("text",
    x = 0.03, y = pos$zero_lab_y, label = lab_zero,
    family = text_family, size = 3.1, color = col_ink, hjust = 0
  ) +
  annotate("text",
    x = pos$rn_x, y = pos$rn_y, label = lab_rn,
    family = text_family, size = 3.1, color = col_muted,
    hjust = 0, lineheight = 1.15
  ) +
  annotate("point", x = pos$half_x, y = 0.5, color = col_ink, size = 2) +
  annotate("segment",
    x = pos$half_lab_x + 0.02, xend = pos$half_x - 0.02,
    y = pos$half_lab_y - 0.03, yend = 0.51,
    color = col_muted, linewidth = 0.3
  ) +
  annotate("text",
    x = pos$half_lab_x, y = pos$half_lab_y, label = lab_half,
    family = text_family, size = 3.1, color = col_muted,
    hjust = 1, vjust = 0, lineheight = 1.1
  ) +
  scale_x_continuous(
    limits = c(x_min, x_max), breaks = seq(-1, 1.5, 0.5),
    labels = label_number(accuracy = 0.1, style_positive = "plus"),
    expand = expansion(mult = c(0.01, 0.02))
  ) +
  scale_y_continuous(
    limits = c(0, 1), breaks = seq(0, 1, 0.25), labels = percent,
    expand = expansion(mult = c(0.01, 0.03))
  ) +
  labs(
    title = title_text,
    subtitle = subtitle_text,
    caption = caption_full,
    x = "AI exposure of the occupations linked to a major (AIOE score)   more exposed \u2192",
    y = "Cumulative share of measured graduates"
  )
```
### [7. Save]{.smallcaps}
```{r}
#| label: save
#| warning: false

### |- save ----
main_path  <- here::here("data_visualizations", "TidyTuesday", "2026", "tt_2026_42.png")
thumb_path <- here::here("data_visualizations", "TidyTuesday", "2026", "thumbnails", "tt_2026_42.png")

# Full-size version, for the QMD figure
ggview::save_ggplot(plot = p, file   = main_path, width  = fig_w,
    height = fig_h, units  = "in", dpi = fig_dpi)

# Reduced-size thumbnail, for the YAML `image:` field
fs::dir_create(dirname(thumb_path))
magick::image_read(main_path) |>
  magick::image_resize("400") |>
  magick::image_write(thumb_path)
```
#### [8. Session Info]{.smallcaps}
::: {.callout-tip collapse="true"}
##### Expand for Session Info
```{r, echo = FALSE}
#| eval: true
#| warning: false
sessionInfo()
```
:::
#### [9. GitHub Repository]{.smallcaps}
::: {.callout-tip collapse="true"}
##### Expand for GitHub Repo
The complete code for this analysis is available in [`tt_2026_42.qmd`](https://github.com/poncest/personal-website/blob/master/data_visualizations/TidyTuesday/2026/tt_2026_42.qmd).
For the full repository, [click here](https://github.com/poncest/personal-website/).
:::
#### [10. References]{.smallcaps}
::: {.callout-tip collapse="true"}
##### Expand for References
1. **Data Source:**
- TidyTuesday 2026 Week 42: [Which College Majors Are Safest From AI (and Do They Pay)?](https://github.com/rfordatascience/tidytuesday/blob/main/data/2026/2026-10-20/readme.md)
:::
#### [11. Custom Functions Documentation]{.smallcaps}
::: {.callout-note collapse="true"}
##### 📦 Custom Helper Functions
This analysis uses custom functions from my personal module library for efficiency and consistency across projects.
**Functions Used:**
- **`fonts.R`**: `setup_fonts()`, `get_font_families()` - Font management with showtext
- **`social_icons.R`**: `create_social_caption()` - Generates formatted social media captions
- **`image_utils.R`**: `save_plot()` - Consistent plot saving with naming conventions
- **`base_theme.R`**: `create_base_theme()`, `extend_weekly_theme()`, `get_theme_colors()` - Custom ggplot2 themes
**Why custom functions?**\
These utilities standardize theming, fonts, and output across all my data visualizations. The core analysis (data tidying and visualization logic) uses only standard tidyverse packages.
**Source Code:**\
View all custom functions → [GitHub: R/utils](https://github.com/poncest/personal-website/tree/master/R)
:::
