---
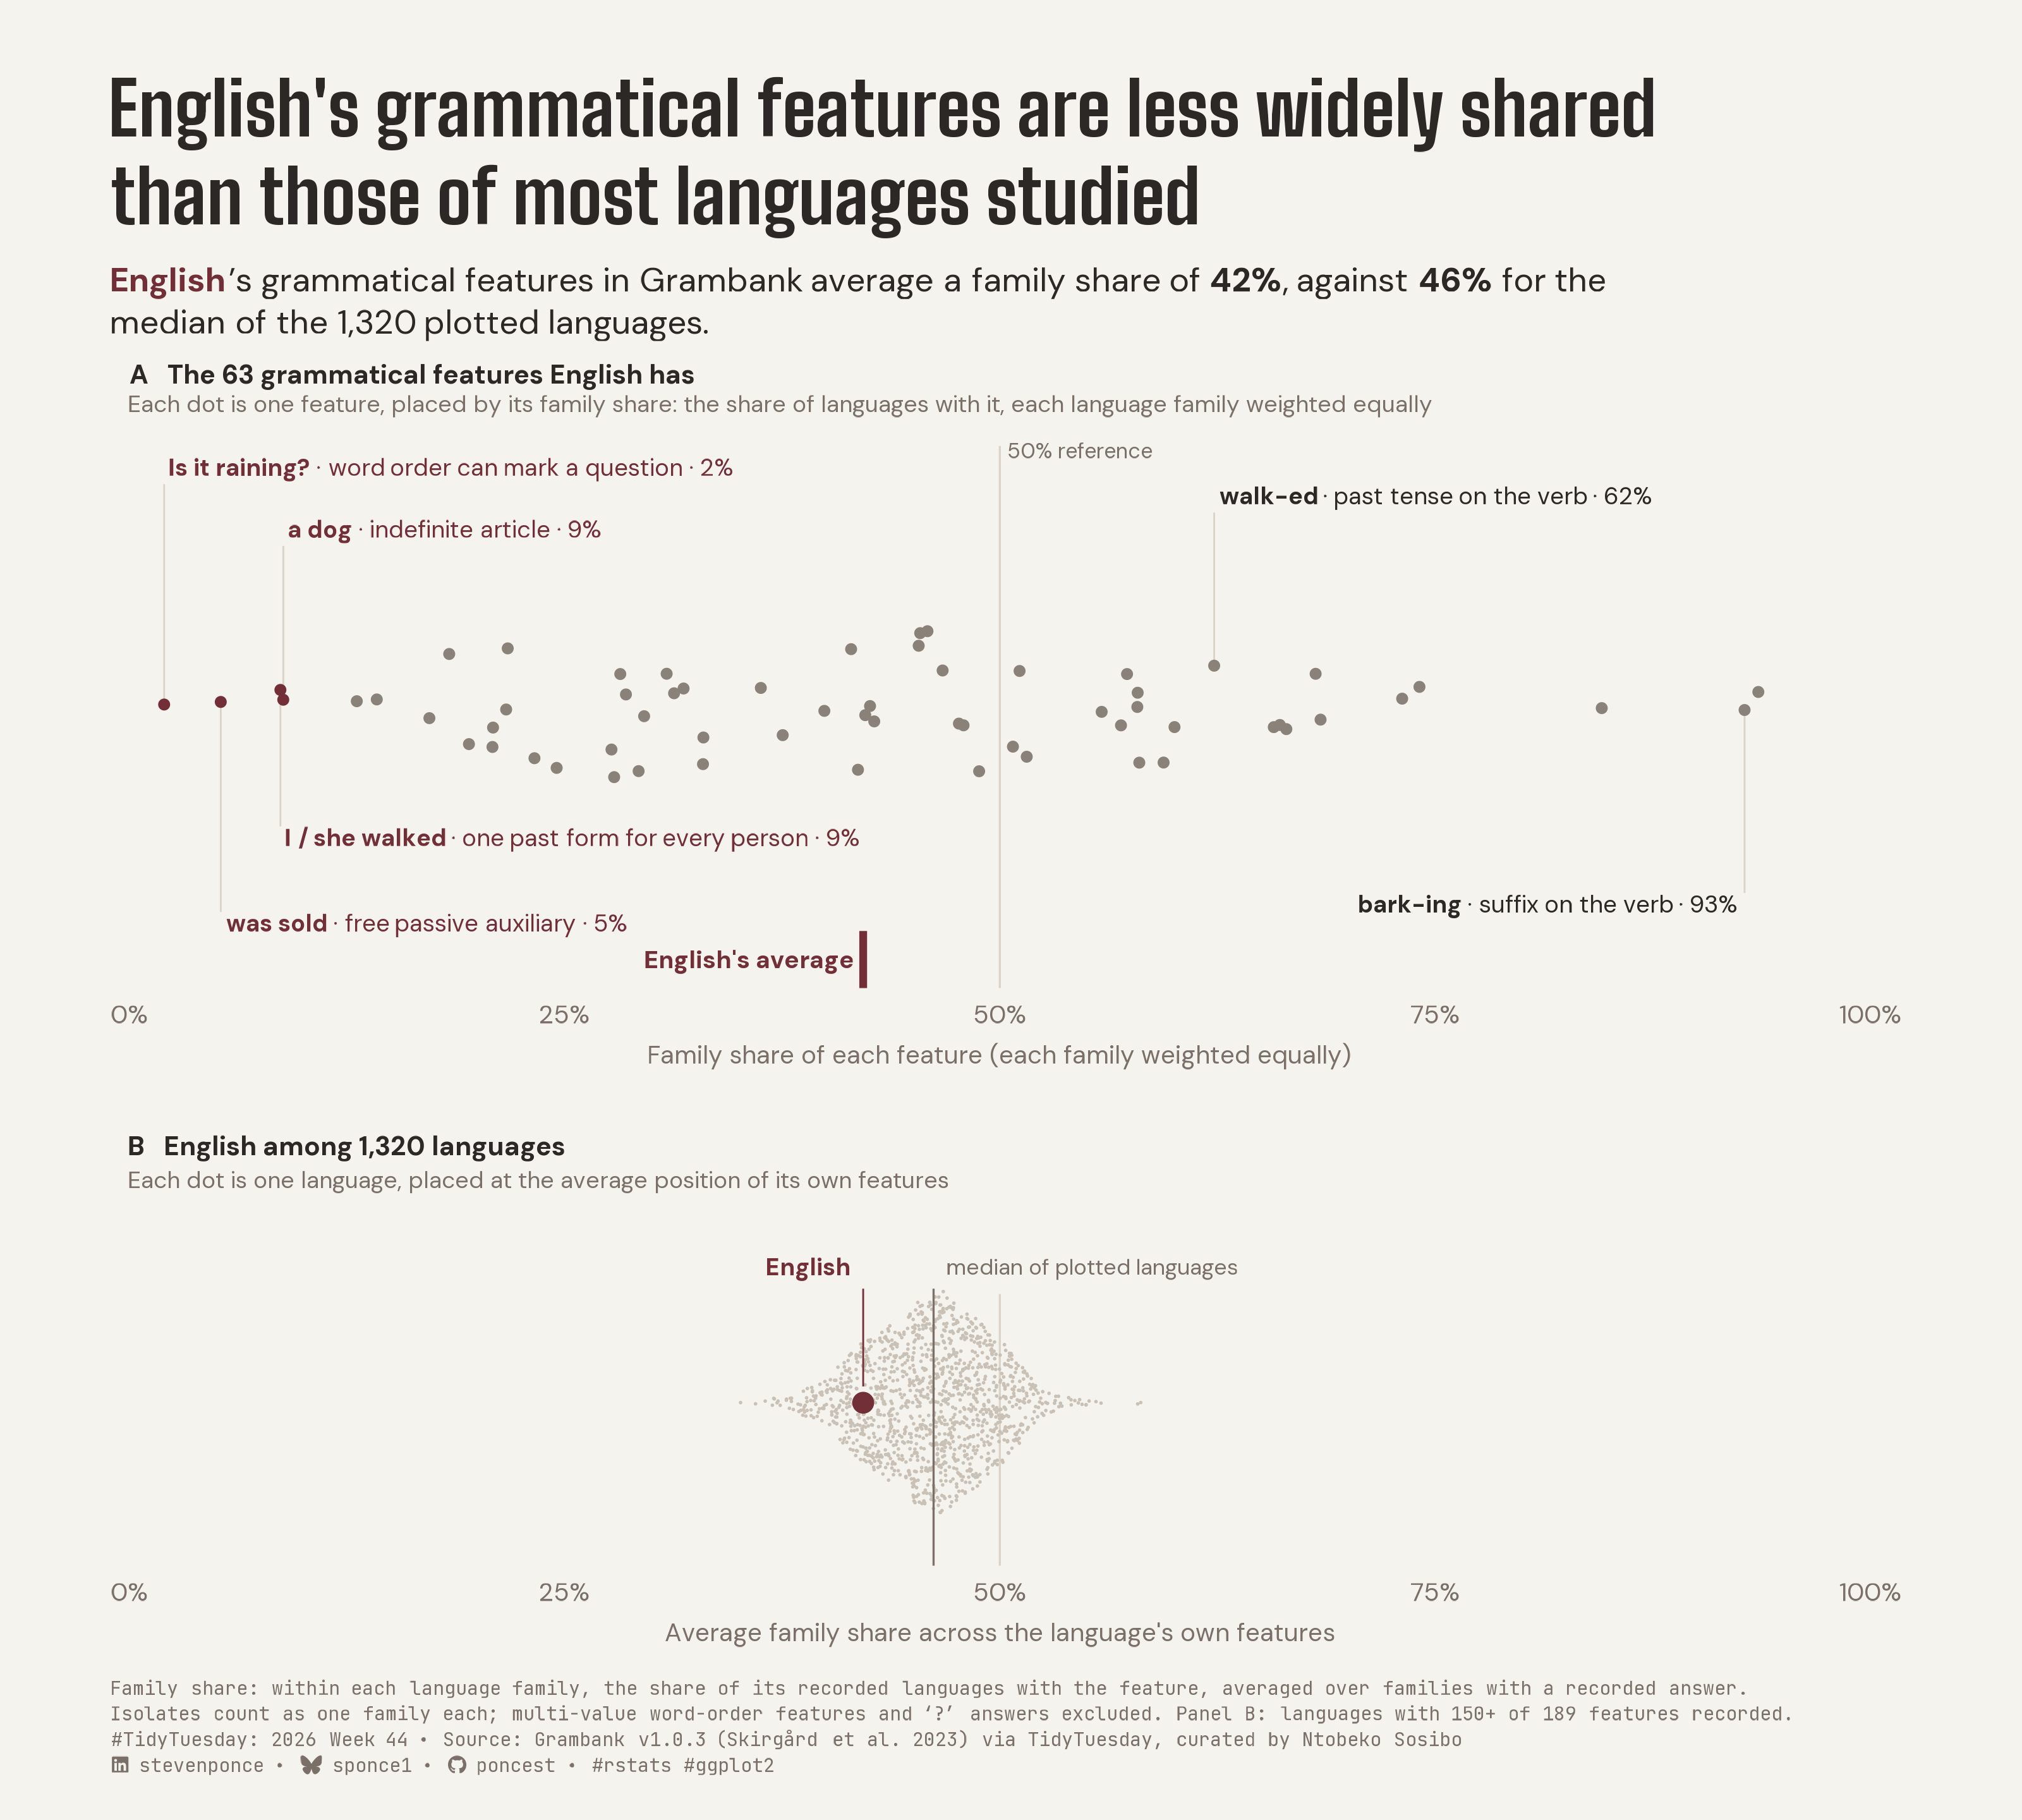
title: "English's grammatical features are less widely shared than those of most languages studied"
subtitle: "English's grammatical features in Grambank average a family share of 42%, against 46% for the median of the 1,320 plotted languages."
description: "English's 63 recorded grammatical features average a family share of 42%, below the 46% median of 1,320 languages in Grambank. Each feature is weighted so every language family counts equally, and each language is placed at the average of its own features on a shared scale. Built in R with ggplot2, ggbeeswarm, patchwork and ggtext."
date: "2026-11-02"
author:
- name: "Steven Ponce"
url: "https://stevenponce.netlify.app"
citation:
url: "https://stevenponce.netlify.app/data_visualizations/TidyTuesday/2026/tt_2026_44.html"
categories: ["TidyTuesday", "2026"]
tags: [
"TidyTuesday",
"Grambank",
"Linguistics",
"Language Typology",
"Grammar",
"English",
"Beeswarm",
"Distribution",
"Family-Weighted Prevalence",
"Small Multiples",
"ggbeeswarm",
"patchwork",
"ggtext",
"2026"
]
image: "thumbnails/tt_2026_44.png"
format:
html:
toc: true
toc-depth: 5
code-link: true
code-fold: true
code-tools: true
code-summary: "Show code"
editor_options:
chunk_output_type: inline
execute:
freeze: true
cache: true
error: false
message: false
warning: false
eval: true
---
{#fig-1}
### [**Steps to Create this Graphic**]{.mark}
#### [1. Load Packages & Setup]{.smallcaps}
```{r}
#| label: load
#| warning: false
#| message: false
#| results: "hide"

## 1. LOAD PACKAGES & SETUP ----
suppressPackageStartupMessages({
if (!require("pacman")) install.packages("pacman")
pacman::p_load(
    tidyverse, ggtext, showtext, scales, glue, ggview,
    ggbeeswarm, patchwork, ragg
    )
})

# Source utility functions
suppressMessages(source(here::here("R/utils/fonts.R")))
source(here::here("R/utils/social_icons.R"))
source(here::here("R/utils/image_utils.R"))
source(here::here("R/themes/base_theme.R"))
```
#### [2. Read in the Data]{.smallcaps}
```{r}
#| label: read
#| include: true
#| eval: true
#| warning: false

### |- figure settings ----
fig_w   <- 10
fig_h   <- 9
fig_dpi <- 320

### |- fonts ----
setup_fonts()
fonts <- get_font_families()
title_family <- fonts$title_1


## 2. READ IN THE DATA ----
## Read every field as character with no NA tokens: Grambank writes isolates' family as
## the literal "NA", and tt_load() cannot be told otherwise.
tt_url <- "https://raw.githubusercontent.com/rfordatascience/tidytuesday/main/data/2026/2026-11-03/"
read_chr <- function(url) {
  read_csv(url, col_types = cols(.default = col_character()), na = character(), show_col_types = FALSE)
}

languages_raw <- read_chr(paste0(tt_url, "grambank_languages.csv"))
parameters_raw <- read_chr(paste0(tt_url, "grambank_parameters.csv"))
values_raw <- read_chr(paste0(tt_url, "grambank_values.csv"))

# Grambank's own languages table (v1.0.3, same release as the TT extract): variety level and
# language-level ID, which the TT extract drops
gb_languages_raw <- read_chr("https://raw.githubusercontent.com/grambank/grambank/v1.0.3/cldf/languages.csv")
```
#### [3. Examine the Data]{.smallcaps}
```{r}
#| label: examine
#| include: true
#| eval: true
#| results: 'hide'
#| warning: false

## 3. EXAMINING THE DATA ----
glimpse(languages_raw)
glimpse(parameters_raw)
glimpse(values_raw)
```
#### [4. Tidy Data]{.smallcaps}
```{r}
#| label: tidy
#| warning: false

### |- analysis frame: one variety per language, no proto-languages ----
multistate_ids <- c("GB024", "GB025", "GB065", "GB130", "GB193", "GB203")

coded_counts <- values_raw |> count(language_id, name = "n_coded")

analysis_ids <- gb_languages_raw |>
  filter(level != "family") |>
  left_join(coded_counts, by = c("ID" = "language_id")) |>
  slice_max(n_coded, n = 1, with_ties = FALSE, by = Language_level_ID) |>
  pull(ID)

languages <- languages_raw |>
  filter(language_id %in% analysis_ids) |>
  mutate(family_unit = if_else(family_name == "NA", paste0("isolate_", language_id), family_name))

binary_values <- values_raw |>
  filter(!parameter_id %in% multistate_ids, language_id %in% analysis_ids) |>
  mutate(present = as.integer(value)) |>
  left_join(languages |> select(language_id, family_unit), by = "language_id")

### |- family-balanced share for each feature ----
## within each family: share of its recorded languages with the feature;
## then the mean over families with a recorded answer (each isolate is one family)
feature_share <- binary_values |>
  summarise(family_rate = mean(present), .by = c(parameter_id, family_unit)) |>
  summarise(family_share = mean(family_rate), n_families = n(), .by = parameter_id)

### |- English's present features (panel A) ----
english_id <- "stan1293"
english_features <- binary_values |>
  filter(language_id == english_id, present == 1) |>
  left_join(feature_share, by = "parameter_id")

### |- each language's average (panel B) ----
min_recorded <- 150
language_avg <- binary_values |>
  left_join(feature_share, by = "parameter_id") |>
  summarise(n_recorded = n(), avg_share = mean(family_share[present == 1]), .by = language_id) |>
  filter(n_recorded >= min_recorded)

english_avg <- language_avg$avg_share[language_avg$language_id == english_id]
median_avg <- median(language_avg$avg_share)
share_more_common <- mean(language_avg$avg_share > english_avg)

### |- named features: four rarest English features + two widely shared controls ----
named_features <- tribble(
  ~parameter_id, ~example,          ~device,                          ~side,
  "GB260",       "Is it raining?",  "word order can mark a question", "rare",
  "GB302",       "was sold",        "free passive auxiliary",         "rare",
  "GB021",       "a dog",           "indefinite article",             "rare",
  "GB400",       "I / she walked",  "one past form for every person", "rare",
  "GB083",       "walk-ed",         "past tense on the verb",         "control",
  "GB080",       "bark-ing",        "suffix on the verb",             "control"
)
```
#### [5. Visualization Parameters]{.smallcaps}
```{r}
#| label: params
#| include: true
#| warning: false

### |- plot aesthetics ----
clrs <- get_theme_colors(
  palette = list(
    accent = "#722F37",
    ink    = "#2C2825",
    dot    = "#8A8178",
    cloud  = "#C9C1B6",
    ref    = "#D9D3C9",
    muted  = "#7A7068"
  )
)
col_accent <- clrs$palette$accent
col_ink <- clrs$palette$ink
col_dot <- clrs$palette$dot
col_cloud <- clrs$palette$cloud
col_ref <- clrs$palette$ref
col_muted <- clrs$palette$muted

### |- titles and caption ----
title_text <- "English's grammatical features are less widely shared\nthan those of most languages studied"

subtitle_text <- glue(
  "<span style='color:{col_accent}'>**English**</span>'s grammatical features in Grambank average a family share of ",
  "**{round(100 * english_avg)}%**, against **{round(100 * median_avg)}%** for the<br>median of the {comma(nrow(language_avg))} plotted languages."
)

cue_a <- "Each dot is one feature, placed by its family share: the share of languages with it, each language family weighted equally"

caption_lines <- c(
  "Family share: within each language family, the share of its recorded languages with the feature, averaged over families with a recorded answer.",
  glue(
    "Isolates count as one family each; multi-value word-order features and '?' answers excluded. ",
    "Panel B: languages with {min_recorded}+ of 189 features recorded."
  )
)

disclosure_text <- glue(
  "{caption_lines[1]}<br>{caption_lines[2]}"
)

caption_text <- paste0(
  disclosure_text, "<br>",
  create_social_caption(
    tt_year = 2026,
    tt_week = 44,
    source_text = "Grambank v1.0.3 (Skirgård et al. 2023) via TidyTuesday, curated by Ntobeko Sosibo"
  )
)

### |- plot theme ----
base_theme <- create_base_theme(clrs)

weekly_theme <- extend_weekly_theme(
  base_theme,
  theme(
    plot.title = element_text(
      face = "bold", family = title_family, size = 26,
      color = col_ink, lineheight = 1.0, margin = margin(b = 10)
    ),
    plot.subtitle = element_markdown(
      family = fonts$subtitle, size = 12, color = col_ink,
      lineheight = 1.25, margin = margin(b = 6)
    ),
    plot.caption = element_markdown(
      family = fonts$caption, size = 6.8, color = col_muted,
      hjust = 0, lineheight = 1.35, margin = margin(t = 12)
    ),
    axis.text.x = element_text(family = fonts$text, size = 9, color = col_muted),
    axis.title.x = element_text(
      family = fonts$text, size = 9, color = col_muted,
      face = "plain", margin = margin(t = 6)
    ),
    axis.text.y = element_blank(),
    axis.title.y = element_blank(),
    axis.ticks = element_blank(),
    panel.grid = element_blank(),
    legend.position = "none",
    plot.margin = margin(14, 24, 8, 20)
  )
)

theme_set(weekly_theme)

### |- shared x scale ----
x_scale <- scale_x_continuous(
  limits = c(0, 1), breaks = seq(0, 1, 0.25),
  labels = label_percent(), expand = expansion(add = c(0.01, 0.01))
)
```
#### [6. Plot]{.smallcaps}
```{r}
#| label: plot
#| warning: false

### |- panel A: English's 63 features ----
set.seed(2026)
swarm_a <- layer_data(
  ggplot(english_features, aes(family_share, 0)) +
    geom_quasirandom(orientation = "y", width = 0.32, method = "pseudorandom", )
) |>
  select(x, y) |>
  bind_cols(english_features |> select(parameter_id, family_share))

labels_a <- named_features |>
  left_join(swarm_a, by = "parameter_id") |>
  mutate(
    pct = round(100 * family_share),
    label = glue("<b>{example}</b> · {device} · {pct}%"),
    label_y = c(0.92, -0.88, 0.66, -0.52, 0.80, -0.80),
    hjust = case_when(parameter_id == "GB080" ~ 1, TRUE ~ 0),
    colour = if_else(side == "rare", col_accent, col_ink)
  )

p_a <- ggplot(swarm_a, aes(x, y)) +
  annotate("segment", x = 0.5, xend = 0.5, y = -1.2, yend = 1.08, color = col_ref, linewidth = 0.35) +
  annotate("text",
    x = 0.505, y = 1.06, label = "50% reference",
    family = fonts$text, size = 2.7, color = col_muted, hjust = 0
  ) +
  geom_segment(
    data = labels_a, aes(x = x, xend = x, y = y, yend = label_y),
    color = col_ref, linewidth = 0.3
  ) +
  geom_point(aes(color = family_share < 0.10), size = 2, stroke = 0) +
  geom_richtext(
    data = labels_a,
    aes(x = x, y = label_y, label = label, hjust = hjust),
    color = labels_a$colour, family = fonts$text, size = 3, fill = NA, label.colour = NA,
    label.padding = unit(c(1, 2, 1, 2), "pt"), vjust = if_else(labels_a$label_y > 0, 0, 1)
  ) +
  annotate("segment",
    x = english_avg, xend = english_avg, y = -1.20, yend = -0.96,
    color = col_accent, linewidth = 1.3, lineend = "butt"
  ) +
  annotate("text",
    x = english_avg - 0.006, y = -1.08, label = "English's average",
    family = fonts$text, size = 3.1, color = col_accent, fontface = "bold", hjust = 1
  ) +
  annotate("text",
    x = 0, y = 1.42, hjust = 0, vjust = 1, family = fonts$text, size = 3.3,
    color = col_ink, fontface = "bold", label = "A   The 63 grammatical features English has"
  ) +
  annotate("text",
    x = 0, y = 1.29, hjust = 0, vjust = 1, family = fonts$text, size = 2.9,
    color = col_muted,
    label = cue_a
  ) +
  scale_color_manual(values = c(`TRUE` = col_accent, `FALSE` = col_dot)) +
  x_scale +
  scale_y_continuous(limits = c(-1.2, 1.45), expand = expansion(0)) +
  labs(
    title = title_text, subtitle = subtitle_text,
    x = "Family share of each feature (each family weighted equally)"
  )

### |- panel B: 1,320 languages at their averages ----
set.seed(2026)
swarm_b <- layer_data(
  ggplot(language_avg, aes(avg_share, 0)) +
    geom_quasirandom(orientation = "y", width = 0.42, method = "pseudorandom")
) |>
  select(x, y)

p_b <- ggplot(language_avg, aes(avg_share, 0)) +
  annotate("segment", x = 0.5, xend = 0.5, y = -0.6, yend = 0.40, color = col_ref, linewidth = 0.35) +
  geom_quasirandom(
    orientation = "y", width = 0.42, method = "pseudorandom",
    size = 0.6, stroke = 0, color = col_cloud
  ) +
  annotate("segment", x = median_avg, xend = median_avg, y = -0.6, yend = 0.42, color = col_muted, linewidth = 0.35) +
  annotate("text",
    x = median_avg + 0.008, y = 0.5, label = "median of plotted languages",
    family = fonts$text, size = 2.8, color = col_muted, hjust = 0
  ) +
  annotate("point", x = english_avg, y = 0, color = col_accent, size = 2.8) +
  annotate("segment",
    x = english_avg, xend = english_avg, y = 0.06, yend = 0.42,
    color = col_accent, linewidth = 0.3
  ) +
  annotate("text",
    x = english_avg - 0.008, y = 0.5, label = "English",
    family = fonts$text, size = 3, color = col_accent, fontface = "bold", hjust = 1
  ) +
  annotate("text",
    x = 0, y = 0.98, hjust = 0, vjust = 1, family = fonts$text, size = 3.3,
    color = col_ink, fontface = "bold",
    label = glue("B   English among {comma(nrow(language_avg))} languages")
  ) +
  annotate("text",
    x = 0, y = 0.85, hjust = 0, vjust = 1, family = fonts$text, size = 2.9,
    color = col_muted,
    label = "Each dot is one language, placed at the average position of its own features"
  ) +
  x_scale +
  scale_y_continuous(limits = c(-0.6, 1.0), expand = expansion(0)) +
  labs(
    x = "Average family share across the language's own features",
    caption = caption_text
  )

### |- combine ----
p <- p_a / p_b + plot_layout(heights = c(1.45, 1))
```
### [7. Save]{.smallcaps}
```{r}
#| label: save
#| warning: false

### |- save ----
main_path  <- here::here("data_visualizations", "TidyTuesday", "2026", "tt_2026_44.png")
thumb_path <- here::here("data_visualizations", "TidyTuesday", "2026", "thumbnails", "tt_2026_44.png")

# Full-size version, for the QMD figure
ggview::save_ggplot(plot = p, file   = main_path, width  = fig_w,
    height = fig_h, units  = "in", dpi = fig_dpi)

# Reduced-size thumbnail, for the YAML `image:` field
fs::dir_create(dirname(thumb_path))
magick::image_read(main_path) |>
  magick::image_resize("400") |>
  magick::image_write(thumb_path)
```
#### [8. Session Info]{.smallcaps}
::: {.callout-tip collapse="true"}
##### Expand for Session Info
```{r, echo = FALSE}
#| eval: true
#| warning: false
sessionInfo()
```
:::
#### [9. GitHub Repository]{.smallcaps}
::: {.callout-tip collapse="true"}
##### Expand for GitHub Repo
The complete code for this analysis is available in [`tt_2026_44.qmd`](https://github.com/poncest/personal-website/blob/master/data_visualizations/TidyTuesday/2026/tt_2026_44.qmd).
For the full repository, [click here](https://github.com/poncest/personal-website/).
:::
#### [10. References]{.smallcaps}
::: {.callout-tip collapse="true"}
##### Expand for References
1. **Data Source:**
- TidyTuesday 2026 Week 44: [Grambank](https://github.com/rfordatascience/tidytuesday/blob/main/data/2026/2026-11-02/readme.md)
:::
#### [11. Custom Functions Documentation]{.smallcaps}
::: {.callout-note collapse="true"}
##### 📦 Custom Helper Functions
This analysis uses custom functions from my personal module library for efficiency and consistency across projects.
**Functions Used:**
- **`fonts.R`**: `setup_fonts()`, `get_font_families()` - Font management with showtext
- **`social_icons.R`**: `create_social_caption()` - Generates formatted social media captions
- **`base_theme.R`**: `create_base_theme()`, `extend_weekly_theme()`, `get_theme_colors()` - Custom ggplot2 themes
**Why custom functions?**\
These utilities standardize theming, fonts, and output across all my data visualizations. The core analysis (data tidying and visualization logic) uses only standard tidyverse packages.
**Source Code:**\
View all custom functions → [GitHub: R/utils](https://github.com/poncest/personal-website/tree/master/R)
:::
