Steven Ponce home pageSteven Ponce home page Steven Ponce
  • About
  • Data Visualizations
  • Projects
  • Behind the Viz
  • Resume
  • Email

On this page

  • Steps to Create this Graphic
    • 1. Load Packages & Setup
    • 2. Read in the Data
    • 3. Examine the Data
    • 4. Tidy Data
    • 5. Visualization Parameters
    • 6. Plot
  • 7. Save
    • 8. Session Info
    • 9. GitHub Repository
    • 10. References
    • 11. Custom Functions Documentation

One fight, two grades

  • Show All Code
  • Hide All Code

  • View Source

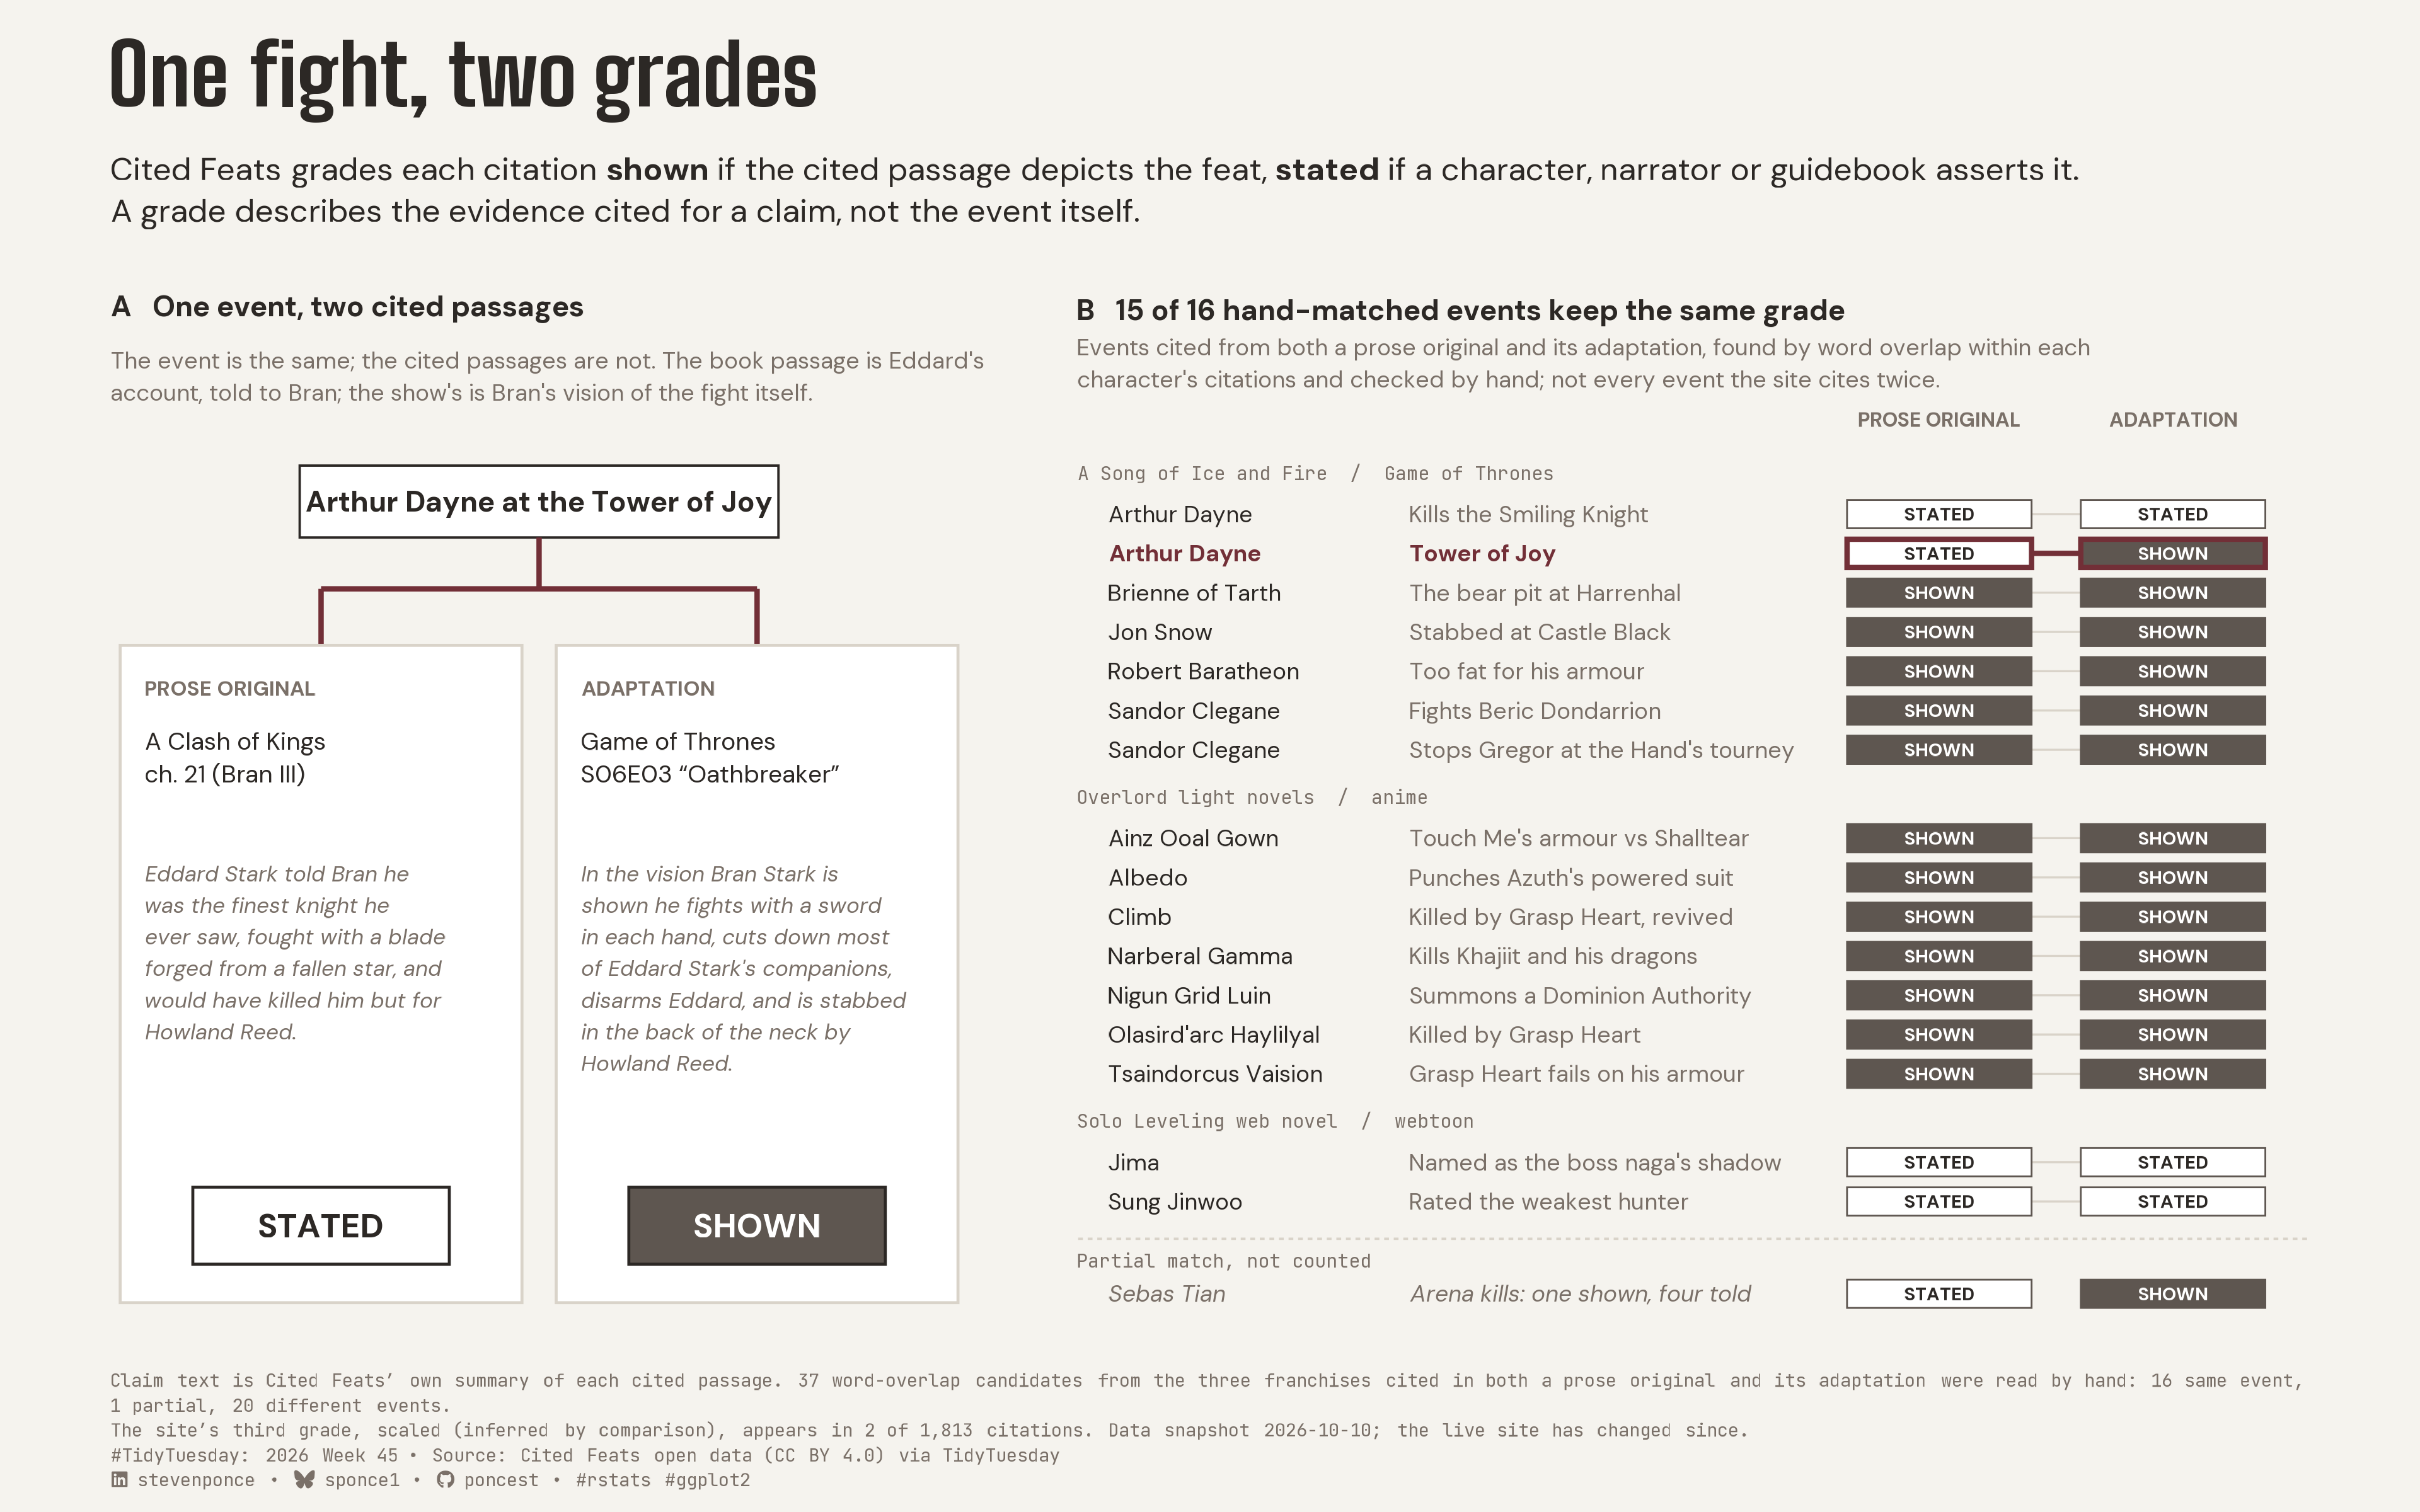
Cited Feats grades each citation shown if the cited passage depicts the feat, stated if a character, narrator or guidebook asserts it. A grade describes the evidence cited for a claim, not the event itself.

TidyTuesday
2026
Arthur Dayne’s Tower of Joy fight is graded stated in the book and shown in the TV show, yet 15 of 16 hand-matched events have the same grade in both. Citation pairs from prose originals and their adaptations were found by word overlap and reviewed by hand. Built in R with ggplot2, patchwork and ggtext.
Author

Steven Ponce

Published

November 9, 2026

Figure 1: Two-panel explainer titled One fight, two grades, showing that Cited Feats grades the evidence cited for a claim, not the event itself. Panel A is a branching diagram: one event, Arthur Dayne at the Tower of Joy, splits into two cited passages. The book passage, A Clash of Kings chapter 21, is Eddard’s account told to Bran and is graded as stated; the Game of Thrones episode S06E03 depicts the fight and is graded as shown. Panel B is a ledger of 16 hand-matched events cited in both a prose original and its adaptation, across A Song of Ice and Fire, Overlord, and Solo Leveling. In 15 of 16, both citations have the same grade; only the Tower of Joy, highlighted in burgundy, differs. One partial match, Sebas Tian, is listed separately and not counted. Data: Cited Feats open data via TidyTuesday.

Steps to Create this Graphic

1. Load Packages & Setup

Show code
```{r}
#| label: load
#| warning: false
#| message: false      
#| results: "hide"     

## 1. LOAD PACKAGES & SETUP ----
suppressPackageStartupMessages({
if (!require("pacman")) install.packages("pacman")
pacman::p_load(
    tidyverse, ggtext, showtext, scales, glue, ggview,
    patchwork, ragg, magick
    )
})

# Source utility functions
suppressMessages(source(here::here("R/utils/fonts.R")))
source(here::here("R/utils/social_icons.R"))
source(here::here("R/utils/image_utils.R"))
source(here::here("R/themes/base_theme.R"))
```

2. Read in the Data

Show code
```{r}
#| label: read
#| include: true
#| eval: true
#| warning: false

### |- figure settings ----
fig_w   <- 12
fig_h   <- 7.5
fig_dpi <- 320

### |- fonts ----
setup_fonts()
fonts <- get_font_families()
title_family <- fonts$title_1


## 2. READ IN THE DATA ----
## Read every field as character with no NA tokens; restore numbers column by column.
tt_url <- "https://raw.githubusercontent.com/rfordatascience/tidytuesday/main/data/2026/2026-11-10/"
read_chr <- function(url) {
    read_csv(url, col_types = cols(.default = col_character()), na = character(), show_col_types = FALSE)
}

citations_raw <- read_chr(paste0(tt_url, "fiction_citations.csv"))
rankings_raw  <- read_chr(paste0(tt_url, "fiction_rankings.csv"))

## Hand-reviewed pool, written by tt_2026_45_match_candidates.R: every word-overlap candidate
## pair (prose original vs adaptation) with its decision -- clean, partial or rejected.
matches_path <- here::here("data/TidyTuesday/2026/tt_2026_45_matched_events.csv")
matches_raw  <- read_chr(matches_path)
```

3. Examine the Data

Show code
```{r}
#| label: examine
#| include: true
#| eval: true
#| results: 'hide'
#| warning: false

## 3. EXAMINING THE DATA ----
glimpse(citations_raw)
glimpse(matches_raw)
citations_raw |> count(type, confidence) |> print(n = Inf)
```

4. Tidy Data

Show code
```{r}
#| label: tidy
#| warning: false

### |- base rates quoted in copy ----
n_citations <- nrow(citations_raw)
n_scaled <- sum(citations_raw$confidence == "scaled")

### |- look up each side of every matched pair in the citations ----
## A side matches when franchise, character, type and locator agree exactly and the
## citation's claim starts with the recorded opening; exactly one citation must match.
lookup_side <- function(slug, entry, type_wanted, loc, claim_start) {
  hit <- citations_raw |>
    filter(
      franchise_slug == slug, subject_id == entry, subject_kind == "entry",
      type == type_wanted, locator == loc, str_starts(claim, fixed(claim_start))
    )
  if (nrow(hit) != 1) stop(glue("{entry} / {loc}: {nrow(hit)} citations matched, expected 1"))
  hit |> select(work, confidence, claim)
}

n_reviewed <- nrow(matches_raw)
n_rejected <- sum(matches_raw$match == "rejected")

pairs <- matches_raw |>
  filter(match != "rejected") |>
  mutate(
    prose = pmap(list(franchise_slug, entry_id, "novel", prose_locator, prose_claim_start), lookup_side),
    adapt = pmap(list(franchise_slug, entry_id, adapt_type, adapt_locator, adapt_claim_start), lookup_side)
  ) |>
  unnest_wider(prose, names_sep = "_") |>
  unnest_wider(adapt, names_sep = "_") |>
  left_join(
    rankings_raw |> select(franchise_slug, entry_id, name, franchise),
    by = c("franchise_slug", "entry_id")
  ) |>
  mutate(changed = prose_confidence != adapt_confidence)

clean_pairs <- pairs |> filter(match == "clean")
n_clean <- nrow(clean_pairs)
n_changed <- sum(clean_pairs$changed)
n_same <- n_clean - n_changed
n_partial <- sum(pairs$match == "partial")

### |- Panel A: the one clean pair whose grade changes ----
hero <- clean_pairs |> filter(changed)
stopifnot(nrow(hero) == 1, hero$entry_id == "arthur-dayne", hero$event_label == "Tower of Joy")

### |- Panel B: row layout, franchise groups with a header row each ----
franchise_order <- c("westeros", "overlord", "solo-leveling")
franchise_head <- c(
  westeros        = "A Song of Ice and Fire  /  Game of Thrones",
  overlord        = "Overlord light novels  /  anime",
  `solo-leveling` = "Solo Leveling web novel  /  webtoon"
)

ledger <- clean_pairs |>
  mutate(franchise_slug = factor(franchise_slug, levels = franchise_order)) |>
  arrange(franchise_slug, name, event_label) |>
  mutate(row = row_number())

## y positions: one slot per row, plus one header slot (and a small gap) per franchise
row_step <- 1
ledger <- ledger |>
  mutate(
    group_idx = as.integer(franchise_slug),
    y = -(row + group_idx * 1.25) * row_step
  )

group_heads <- ledger |>
  summarise(y = max(y) + 1.05 * row_step, .by = franchise_slug) |>
  mutate(label = franchise_head[as.character(franchise_slug)])

partial_row <- pairs |>
  filter(match == "partial") |>
  mutate(y = min(ledger$y) - 2.1 * row_step)
```

5. Visualization Parameters

Show code
```{r}
#| label: params
#| include: true
#| warning: false

### |- plot aesthetics ----
clrs <- get_theme_colors(
  palette = list(
    accent = "#722F37",
    ink    = "#2C2825",
    shown  = "#5E5650",
    stated = "#FFFFFF",
    rule   = "#D9D3C9",
    muted  = "#7A7068",
    card   = "#FFFFFF"
  )
)
col_accent <- clrs$palette$accent
col_ink <- clrs$palette$ink
col_shown <- clrs$palette$shown
col_stated <- clrs$palette$stated
col_rule <- clrs$palette$rule
col_muted <- clrs$palette$muted
col_card <- clrs$palette$card

### |- titles and caption ----
title_text <- "One fight, two grades"

subtitle_text <- glue(
    "Cited Feats grades each citation **shown** if the cited passage depicts the feat, ",
    "**stated** if a character, narrator or guidebook asserts it.<br>",
    "A grade describes the evidence cited for a claim, not the event itself."
)

cue_a <- "The event is the same; the cited passages are not. The book passage is Eddard's\naccount, told to Bran; the show's is Bran's vision of the fight itself."

head_b <- glue("B   {n_same} of {n_clean} hand-matched events keep the same grade")
cue_b  <- glue(
    "Events cited from both a prose original and its adaptation, found by word overlap within each\n",
    "character's citations and checked by hand; not every event the site cites twice."
)

caption_lines <- c(
    glue(
        "Claim text is Cited Feats' own summary of each cited passage. {n_reviewed} word-overlap candidates from the three franchises cited in both ",
        "a prose original and its adaptation were read by hand: {n_clean} same event, {n_partial} partial, {n_rejected} different events."
    ),
    glue(
        "The site's third grade, scaled (inferred by comparison), appears in {n_scaled} of {comma(n_citations)} citations. ",
        "Data snapshot 2026-10-10; the live site has changed since."
    )
)

caption_text <- paste0(
    caption_lines[1], "<br>", caption_lines[2], "<br>",
    create_social_caption(
        tt_year = 2026,
        tt_week = 45,
        source_text = "Cited Feats open data (CC BY 4.0) via TidyTuesday"
    )
)

### |- plot theme ----
base_theme <- create_base_theme(clrs)

weekly_theme <- extend_weekly_theme(
    base_theme,
    theme(
        plot.title = element_textbox_simple(
            face = "bold", family = title_family, size = 30,
            color = col_ink, lineheight = 1.0, margin = margin(b = 12)
        ),
        plot.subtitle = element_textbox_simple(
            family = fonts$subtitle, size = 11.5, color = col_ink,
            lineheight = 1.3, margin = margin(b = 10)
        ),
        plot.caption = element_textbox_simple(
            family = fonts$caption, size = 6.6, color = col_muted,
            lineheight = 1.35, margin = margin(t = 10)
        ),
        axis.text = element_blank(),
        axis.title = element_blank(),
        axis.ticks = element_blank(),
        panel.grid = element_blank(),
        legend.position = "none",
        plot.margin = margin(14, 20, 8, 20)
    )
)

theme_set(weekly_theme)
```

6. Plot

Show code
```{r}
#| label: plot
#| warning: false

### |- grade chip helper (shared by both panels) ----
chip_layer <- function(df, x, y, grade, w, h, size, border, lw) {
    list(
        geom_tile(
            data = df, aes(x = {{ x }}, y = {{ y }}),
            width = w, height = h,
            fill = if_else(pull(df, {{ grade }}) == "shown", col_shown, col_stated),
            color = border, linewidth = lw
        ),
        geom_text(
            data = df, aes(x = {{ x }}, y = {{ y }}, label = str_to_upper({{ grade }})),
            family = fonts$text, fontface = "bold", size = size,
            color = if_else(pull(df, {{ grade }}) == "shown", "white", col_ink)
        )
    )
}

### |- panel A: one event, two cited passages ----
cards <- tibble(
    side   = c("prose", "adapt"),
    x      = c(0.245, 0.755),
    head   = c("PROSE ORIGINAL", "ADAPTATION"),
    source = c(
        glue("{hero$prose_work}\n{hero$prose_locator}"),
        glue("{hero$adapt_work}\n{hero$adapt_locator}")
    ),
    claim  = c(str_wrap(hero$prose_claim, 30), str_wrap(hero$adapt_claim, 30)),
    grade  = c(hero$prose_confidence, hero$adapt_confidence)
)
card_w <- 0.47
card_bottom <- 0.02
card_top <- 0.66

p_a <- ggplot() +
    # panel heading and decoding cue
    annotate("text",
             x = 0, y = 1.00, hjust = 0, vjust = 1, family = fonts$text, size = 3.6,
             fontface = "bold", color = col_ink, label = "A   One event, two cited passages"
    ) +
    annotate("text",
             x = 0, y = 0.945, hjust = 0, vjust = 1, family = fonts$text, size = 2.9,
             color = col_muted, lineheight = 1.15, label = cue_a
    ) +
    # the event
    annotate("rect",
             xmin = 0.22, xmax = 0.78, ymin = 0.765, ymax = 0.835,
             fill = col_card, color = col_ink, linewidth = 0.4
    ) +
    annotate("text",
             x = 0.5, y = 0.80, family = fonts$text, size = 3.6, fontface = "bold",
             color = col_ink, label = glue("{hero$name} at the {hero$event_label}")
    ) +
    # the branch: the accent marks the change, not a grade
    annotate("segment", x = 0.5, xend = 0.5, y = 0.765, yend = 0.715, color = col_accent, linewidth = 0.9) +
    annotate("segment", x = 0.245, xend = 0.755, y = 0.715, yend = 0.715, color = col_accent, linewidth = 0.9) +
    annotate("segment", x = 0.245, xend = 0.245, y = 0.715, yend = card_top, color = col_accent, linewidth = 0.9) +
    annotate("segment", x = 0.755, xend = 0.755, y = 0.715, yend = card_top, color = col_accent, linewidth = 0.9) +
    # the two cards
    geom_rect(
        data = cards,
        aes(xmin = x - card_w / 2, xmax = x + card_w / 2, ymin = card_bottom, ymax = card_top),
        fill = col_card, color = col_rule, linewidth = 0.5
    ) +
    geom_text(
        data = cards, aes(x = x - card_w / 2 + 0.03, y = card_top - 0.035, label = head),
        hjust = 0, vjust = 1, family = fonts$text, size = 2.6, fontface = "bold", color = col_muted
    ) +
    geom_text(
        data = cards, aes(x = x - card_w / 2 + 0.03, y = card_top - 0.085, label = source),
        hjust = 0, vjust = 1, family = fonts$text, size = 3.1, color = col_ink, lineheight = 1.1
    ) +
    geom_text(
        data = cards, aes(x = x - card_w / 2 + 0.03, y = card_top - 0.215, label = claim),
        hjust = 0, vjust = 1, family = fonts$text, size = 2.75, fontface = "italic",
        color = col_muted, lineheight = 1.2
    ) +
    chip_layer(
        cards |> mutate(cy = card_bottom + 0.075), x, cy, grade,
        w = 0.30, h = 0.075, size = 4.2, border = col_ink, lw = 0.5
    ) +
    scale_x_continuous(limits = c(0, 1), expand = expansion(0)) +
    scale_y_continuous(limits = c(0, 1), expand = expansion(0)) +
    coord_cartesian(clip = "off")

### |- panel B: the whole reviewed pool ----
x_name  <- 0.025
x_event <- 0.27
x_prose <- 0.70
x_adapt <- 0.89
chip_w  <- 0.15
chip_h  <- 0.72
y_top   <- max(group_heads$y) + 1.9

p_b <- ggplot() +
    # panel heading and decoding cue
    annotate("text",
             x = 0, y = y_top + 2.5, hjust = 0, vjust = 1, family = fonts$text, size = 3.6,
             fontface = "bold", color = col_ink, label = head_b
    ) +
    annotate("text",
             x = 0, y = y_top + 1.5, hjust = 0, vjust = 1, family = fonts$text, size = 2.9,
             color = col_muted, lineheight = 1.15, label = cue_b
    ) +
    # column headers
    annotate("text",
             x = c(x_prose, x_adapt), y = y_top - 0.55, label = c("PROSE ORIGINAL", "ADAPTATION"),
             family = fonts$text, size = 2.5, fontface = "bold", color = col_muted
    ) +
    # franchise group headers
    geom_text(
        data = group_heads, aes(x = 0, y = y, label = label),
        hjust = 0, family = fonts$caption, size = 2.4, color = col_muted
    ) +
    # rows: name and event
    geom_text(
        data = ledger, aes(x = x_name, y = y, label = name),
        hjust = 0, family = fonts$text, size = 2.9,
        fontface = if_else(ledger$changed, "bold", "plain"),
        color = if_else(ledger$changed, col_accent, col_ink)
    ) +
    geom_text(
        data = ledger, aes(x = x_event, y = y, label = event_label),
        hjust = 0, family = fonts$text, size = 2.9,
        fontface = if_else(ledger$changed, "bold", "plain"),
        color = if_else(ledger$changed, col_accent, col_muted)
    ) +
    # connector between the two grades
    geom_segment(
        data = ledger,
        aes(x = x_prose + chip_w / 2, xend = x_adapt - chip_w / 2, y = y, yend = y),
        color = if_else(ledger$changed, col_accent, col_rule),
        linewidth = if_else(ledger$changed, 0.9, 0.35)
    ) +
    chip_layer(
        ledger, x_prose, y, prose_confidence,
        w = chip_w, h = chip_h, size = 2.3,
        border = if_else(ledger$changed, col_accent, col_shown),
        lw = if_else(ledger$changed, 0.9, 0.3)
    ) +
    chip_layer(
        ledger, x_adapt, y, adapt_confidence,
        w = chip_w, h = chip_h, size = 2.3,
        border = if_else(ledger$changed, col_accent, col_shown),
        lw = if_else(ledger$changed, 0.9, 0.3)
    ) +
    # partial match, outside the count
    annotate("segment",
             x = 0, xend = 1, y = partial_row$y + 1.15, yend = partial_row$y + 1.15,
             color = col_rule, linewidth = 0.4, linetype = "22"
    ) +
    annotate("text",
             x = 0, y = partial_row$y + 0.6, hjust = 0, family = fonts$caption, size = 2.4,
             color = col_muted, label = "Partial match, not counted"
    ) +
    geom_text(
        data = partial_row, aes(x = x_name, y = y - 0.25, label = name),
        hjust = 0, family = fonts$text, size = 2.9, fontface = "italic", color = col_muted
    ) +
    geom_text(
        data = partial_row, aes(x = x_event, y = y - 0.25, label = event_label),
        hjust = 0, family = fonts$text, size = 2.9, fontface = "italic", color = col_muted
    ) +
    chip_layer(
        partial_row |> mutate(y = y - 0.25), x_prose, y, prose_confidence,
        w = chip_w, h = chip_h, size = 2.3, border = col_shown, lw = 0.3
    ) +
    chip_layer(
        partial_row |> mutate(y = y - 0.25), x_adapt, y, adapt_confidence,
        w = chip_w, h = chip_h, size = 2.3, border = col_shown, lw = 0.3
    ) +
    scale_x_continuous(limits = c(0, 1), expand = expansion(0)) +
    scale_y_continuous(limits = c(partial_row$y - 1, y_top + 2.6), expand = expansion(0)) +
    coord_cartesian(clip = "off")

### |- combine ----
p <- p_a + p_b +
    plot_layout(widths = c(0.82, 1.18)) +
    plot_annotation(
        title = title_text, subtitle = subtitle_text, caption = caption_text,
        theme = weekly_theme
    )
```

7. Save

Show code
```{r}
#| label: save
#| warning: false

### |- save ----
main_path  <- here::here("data_visualizations", "TidyTuesday", "2026", "tt_2026_45.png")
thumb_path <- here::here("data_visualizations", "TidyTuesday", "2026", "thumbnails", "tt_2026_45.png")

# Full-size version, for the QMD figure
ggview::save_ggplot(plot = p, file   = main_path, width  = fig_w,
    height = fig_h, units  = "in", dpi = fig_dpi)

# Reduced-size thumbnail, for the YAML `image:` field
fs::dir_create(dirname(thumb_path))
magick::image_read(main_path) |>
  magick::image_resize("400") |>
  magick::image_write(thumb_path)
```

8. Session Info

TipExpand for Session Info
R version 4.6.1 (2026-06-24)
Platform: aarch64-apple-darwin23
Running under: macOS Tahoe 26.7.2

Matrix products: default
BLAS:   /Library/Frameworks/R.framework/Versions/4.6/Resources/lib/libRblas.0.dylib 
LAPACK: /Library/Frameworks/R.framework/Versions/4.6/Resources/lib/libRlapack.dylib;  LAPACK version 3.12.1

locale:
[1] en_US.UTF-8/en_US.UTF-8/en_US.UTF-8/C/en_US.UTF-8/en_US.UTF-8

time zone: America/New_York
tzcode source: internal

attached base packages:
[1] stats     graphics  grDevices utils     datasets  methods   base     

other attached packages:
 [1] here_1.0.2      magick_2.9.1    ragg_1.5.2      patchwork_1.3.2
 [5] ggview_0.2.2    glue_1.8.1      scales_1.4.0    showtext_0.9-8 
 [9] showtextdb_3.0  sysfonts_0.8.9  ggtext_0.2.0    lubridate_1.9.5
[13] forcats_1.0.1   stringr_1.6.0   dplyr_1.2.1     purrr_1.2.2    
[17] readr_2.2.0     tidyr_1.3.2     tibble_3.3.1    ggplot2_4.0.3  
[21] tidyverse_2.0.0 pacman_0.5.1   

loaded via a namespace (and not attached):
 [1] gtable_0.3.6       xfun_0.60          htmlwidgets_1.6.4  tzdb_0.5.0        
 [5] vctrs_0.7.3        tools_4.6.1        generics_0.1.4     curl_7.1.0        
 [9] parallel_4.6.1     pkgconfig_2.0.3    RColorBrewer_1.1-3 S7_0.2.2          
[13] lifecycle_1.0.5    compiler_4.6.1     farver_2.1.2       textshaping_1.0.5 
[17] codetools_0.2-20   litedown_0.10      htmltools_0.5.9    yaml_2.3.12       
[21] pillar_1.11.1      crayon_1.5.3       commonmark_2.0.0   tidyselect_1.2.1  
[25] digest_0.6.39      stringi_1.8.7      labeling_0.4.3     rprojroot_2.1.1   
[29] fastmap_1.2.0      grid_4.6.1         cli_3.6.6          magrittr_2.0.5    
[33] utf8_1.2.6         withr_3.0.3        bit64_4.8.2        timechange_0.4.0  
[37] rmarkdown_2.31     bit_4.6.0          otel_0.2.0         hms_1.1.4         
[41] evaluate_1.0.5     knitr_1.51         markdown_2.0       rlang_1.3.0       
[45] gridtext_0.1.6     Rcpp_1.1.2         xml2_1.6.0         rstudioapi_0.19.0 
[49] vroom_1.7.1        jsonlite_2.0.0     R6_2.6.1           fs_2.1.0          
[53] systemfonts_1.3.2 

9. GitHub Repository

TipExpand for GitHub Repo

The complete code for this analysis is available in tt_2026_45.qmd.

For the full repository, click here.

10. References

TipExpand for References
  1. Data Source:
    • TidyTuesday 2026 Week 44: evidence-graded power rankings of fictional characters

11. Custom Functions Documentation

Note📦 Custom Helper Functions

This analysis uses custom functions from my personal module library for efficiency and consistency across projects.

Functions Used:

  • fonts.R: setup_fonts(), get_font_families() - Font management with showtext
  • social_icons.R: create_social_caption() - Generates formatted social media captions
  • base_theme.R: create_base_theme(), extend_weekly_theme(), get_theme_colors() - Custom ggplot2 themes

Why custom functions?
These utilities standardize theming, fonts, and output across all my data visualizations. The core analysis (data tidying and visualization logic) uses only standard tidyverse packages.

Source Code:
View all custom functions → GitHub: R/utils

Back to top

Citation

BibTeX citation:
@online{ponce2026,
  author = {Ponce, Steven},
  title = {One Fight, Two Grades},
  date = {2026-11-09},
  url = {https://stevenponce.netlify.app/data_visualizations/TidyTuesday/2026/tt_2026_45.html},
  langid = {en}
}
For attribution, please cite this work as:
Ponce, Steven. 2026. “One Fight, Two Grades.” November 9. https://stevenponce.netlify.app/data_visualizations/TidyTuesday/2026/tt_2026_45.html.
Source Code
---
title: "One fight, two grades"
subtitle: "Cited Feats grades each citation shown if the cited passage depicts the feat, stated if a character, narrator or guidebook asserts it. A grade describes the evidence cited for a claim, not the event itself."
description: "Arthur Dayne's Tower of Joy fight is graded stated in the book and shown in the TV show, yet 15 of 16 hand-matched events have the same grade in both. Citation pairs from prose originals and their adaptations were found by word overlap and reviewed by hand. Built in R with ggplot2, patchwork and ggtext."
date: "2026-11-09"
author:
  - name: "Steven Ponce"
    url: "https://stevenponce.netlify.app"
citation:
  url: "https://stevenponce.netlify.app/data_visualizations/TidyTuesday/2026/tt_2026_45.html"
categories: ["TidyTuesday", "2026"]
tags: [
  "TidyTuesday",
  "Cited Feats",
  "Fictional Characters",
  "Evidence Grading",
  "Game of Thrones",
  "Provenance Diagram",
  "Paired Comparison",
  "Explainer",
  "Annotation",
  "patchwork",
  "ggtext",
  "ggplot2",
  "2026"
]
image: "thumbnails/tt_2026_45.png"
format:
  html:
    toc: true
    toc-depth: 5
    code-link: true
    code-fold: true
    code-tools: true
    code-summary: "Show code"
editor_options: 
  chunk_output_type: inline
execute: 
  freeze: true
  cache: true
  error: false
  message: false
  warning: false
  eval: true
---
![Two-panel explainer titled One fight, two grades, showing that Cited Feats grades the evidence cited for a claim, not the event itself. Panel A is a branching diagram: one event, Arthur Dayne at the Tower of Joy, splits into two cited passages. The book passage, A Clash of Kings chapter 21, is Eddard's account told to Bran and is graded as stated; the Game of Thrones episode S06E03 depicts the fight and is graded as shown. Panel B is a ledger of 16 hand-matched events cited in both a prose original and its adaptation, across A Song of Ice and Fire, Overlord, and Solo Leveling. In 15 of 16, both citations have the same grade; only the Tower of Joy, highlighted in burgundy, differs. One partial match, Sebas Tian, is listed separately and not counted. Data: Cited Feats open data via TidyTuesday.](tt_2026_45.png){#fig-1}

### [**Steps to Create this Graphic**]{.mark}

#### [1. Load Packages & Setup]{.smallcaps}

```{r}
#| label: load
#| warning: false
#| message: false      
#| results: "hide"     

## 1. LOAD PACKAGES & SETUP ----
suppressPackageStartupMessages({
if (!require("pacman")) install.packages("pacman")
pacman::p_load(
    tidyverse, ggtext, showtext, scales, glue, ggview,
    patchwork, ragg, magick
    )
})

# Source utility functions
suppressMessages(source(here::here("R/utils/fonts.R")))
source(here::here("R/utils/social_icons.R"))
source(here::here("R/utils/image_utils.R"))
source(here::here("R/themes/base_theme.R"))
```

#### [2. Read in the Data]{.smallcaps}

```{r}
#| label: read
#| include: true
#| eval: true
#| warning: false

### |- figure settings ----
fig_w   <- 12
fig_h   <- 7.5
fig_dpi <- 320

### |- fonts ----
setup_fonts()
fonts <- get_font_families()
title_family <- fonts$title_1


## 2. READ IN THE DATA ----
## Read every field as character with no NA tokens; restore numbers column by column.
tt_url <- "https://raw.githubusercontent.com/rfordatascience/tidytuesday/main/data/2026/2026-11-10/"
read_chr <- function(url) {
    read_csv(url, col_types = cols(.default = col_character()), na = character(), show_col_types = FALSE)
}

citations_raw <- read_chr(paste0(tt_url, "fiction_citations.csv"))
rankings_raw  <- read_chr(paste0(tt_url, "fiction_rankings.csv"))

## Hand-reviewed pool, written by tt_2026_45_match_candidates.R: every word-overlap candidate
## pair (prose original vs adaptation) with its decision -- clean, partial or rejected.
matches_path <- here::here("data/TidyTuesday/2026/tt_2026_45_matched_events.csv")
matches_raw  <- read_chr(matches_path)
```

#### [3. Examine the Data]{.smallcaps}

```{r}
#| label: examine
#| include: true
#| eval: true
#| results: 'hide'
#| warning: false

## 3. EXAMINING THE DATA ----
glimpse(citations_raw)
glimpse(matches_raw)
citations_raw |> count(type, confidence) |> print(n = Inf)
```

#### [4. Tidy Data]{.smallcaps}

```{r}
#| label: tidy
#| warning: false

### |- base rates quoted in copy ----
n_citations <- nrow(citations_raw)
n_scaled <- sum(citations_raw$confidence == "scaled")

### |- look up each side of every matched pair in the citations ----
## A side matches when franchise, character, type and locator agree exactly and the
## citation's claim starts with the recorded opening; exactly one citation must match.
lookup_side <- function(slug, entry, type_wanted, loc, claim_start) {
  hit <- citations_raw |>
    filter(
      franchise_slug == slug, subject_id == entry, subject_kind == "entry",
      type == type_wanted, locator == loc, str_starts(claim, fixed(claim_start))
    )
  if (nrow(hit) != 1) stop(glue("{entry} / {loc}: {nrow(hit)} citations matched, expected 1"))
  hit |> select(work, confidence, claim)
}

n_reviewed <- nrow(matches_raw)
n_rejected <- sum(matches_raw$match == "rejected")

pairs <- matches_raw |>
  filter(match != "rejected") |>
  mutate(
    prose = pmap(list(franchise_slug, entry_id, "novel", prose_locator, prose_claim_start), lookup_side),
    adapt = pmap(list(franchise_slug, entry_id, adapt_type, adapt_locator, adapt_claim_start), lookup_side)
  ) |>
  unnest_wider(prose, names_sep = "_") |>
  unnest_wider(adapt, names_sep = "_") |>
  left_join(
    rankings_raw |> select(franchise_slug, entry_id, name, franchise),
    by = c("franchise_slug", "entry_id")
  ) |>
  mutate(changed = prose_confidence != adapt_confidence)

clean_pairs <- pairs |> filter(match == "clean")
n_clean <- nrow(clean_pairs)
n_changed <- sum(clean_pairs$changed)
n_same <- n_clean - n_changed
n_partial <- sum(pairs$match == "partial")

### |- Panel A: the one clean pair whose grade changes ----
hero <- clean_pairs |> filter(changed)
stopifnot(nrow(hero) == 1, hero$entry_id == "arthur-dayne", hero$event_label == "Tower of Joy")

### |- Panel B: row layout, franchise groups with a header row each ----
franchise_order <- c("westeros", "overlord", "solo-leveling")
franchise_head <- c(
  westeros        = "A Song of Ice and Fire  /  Game of Thrones",
  overlord        = "Overlord light novels  /  anime",
  `solo-leveling` = "Solo Leveling web novel  /  webtoon"
)

ledger <- clean_pairs |>
  mutate(franchise_slug = factor(franchise_slug, levels = franchise_order)) |>
  arrange(franchise_slug, name, event_label) |>
  mutate(row = row_number())

## y positions: one slot per row, plus one header slot (and a small gap) per franchise
row_step <- 1
ledger <- ledger |>
  mutate(
    group_idx = as.integer(franchise_slug),
    y = -(row + group_idx * 1.25) * row_step
  )

group_heads <- ledger |>
  summarise(y = max(y) + 1.05 * row_step, .by = franchise_slug) |>
  mutate(label = franchise_head[as.character(franchise_slug)])

partial_row <- pairs |>
  filter(match == "partial") |>
  mutate(y = min(ledger$y) - 2.1 * row_step)
```

#### [5. Visualization Parameters]{.smallcaps}

```{r}
#| label: params
#| include: true
#| warning: false

### |- plot aesthetics ----
clrs <- get_theme_colors(
  palette = list(
    accent = "#722F37",
    ink    = "#2C2825",
    shown  = "#5E5650",
    stated = "#FFFFFF",
    rule   = "#D9D3C9",
    muted  = "#7A7068",
    card   = "#FFFFFF"
  )
)
col_accent <- clrs$palette$accent
col_ink <- clrs$palette$ink
col_shown <- clrs$palette$shown
col_stated <- clrs$palette$stated
col_rule <- clrs$palette$rule
col_muted <- clrs$palette$muted
col_card <- clrs$palette$card

### |- titles and caption ----
title_text <- "One fight, two grades"

subtitle_text <- glue(
    "Cited Feats grades each citation **shown** if the cited passage depicts the feat, ",
    "**stated** if a character, narrator or guidebook asserts it.<br>",
    "A grade describes the evidence cited for a claim, not the event itself."
)

cue_a <- "The event is the same; the cited passages are not. The book passage is Eddard's\naccount, told to Bran; the show's is Bran's vision of the fight itself."

head_b <- glue("B   {n_same} of {n_clean} hand-matched events keep the same grade")
cue_b  <- glue(
    "Events cited from both a prose original and its adaptation, found by word overlap within each\n",
    "character's citations and checked by hand; not every event the site cites twice."
)

caption_lines <- c(
    glue(
        "Claim text is Cited Feats' own summary of each cited passage. {n_reviewed} word-overlap candidates from the three franchises cited in both ",
        "a prose original and its adaptation were read by hand: {n_clean} same event, {n_partial} partial, {n_rejected} different events."
    ),
    glue(
        "The site's third grade, scaled (inferred by comparison), appears in {n_scaled} of {comma(n_citations)} citations. ",
        "Data snapshot 2026-10-10; the live site has changed since."
    )
)

caption_text <- paste0(
    caption_lines[1], "<br>", caption_lines[2], "<br>",
    create_social_caption(
        tt_year = 2026,
        tt_week = 45,
        source_text = "Cited Feats open data (CC BY 4.0) via TidyTuesday"
    )
)

### |- plot theme ----
base_theme <- create_base_theme(clrs)

weekly_theme <- extend_weekly_theme(
    base_theme,
    theme(
        plot.title = element_textbox_simple(
            face = "bold", family = title_family, size = 30,
            color = col_ink, lineheight = 1.0, margin = margin(b = 12)
        ),
        plot.subtitle = element_textbox_simple(
            family = fonts$subtitle, size = 11.5, color = col_ink,
            lineheight = 1.3, margin = margin(b = 10)
        ),
        plot.caption = element_textbox_simple(
            family = fonts$caption, size = 6.6, color = col_muted,
            lineheight = 1.35, margin = margin(t = 10)
        ),
        axis.text = element_blank(),
        axis.title = element_blank(),
        axis.ticks = element_blank(),
        panel.grid = element_blank(),
        legend.position = "none",
        plot.margin = margin(14, 20, 8, 20)
    )
)

theme_set(weekly_theme)
```

#### [6. Plot]{.smallcaps}

```{r}
#| label: plot
#| warning: false


### |- grade chip helper (shared by both panels) ----
chip_layer <- function(df, x, y, grade, w, h, size, border, lw) {
    list(
        geom_tile(
            data = df, aes(x = {{ x }}, y = {{ y }}),
            width = w, height = h,
            fill = if_else(pull(df, {{ grade }}) == "shown", col_shown, col_stated),
            color = border, linewidth = lw
        ),
        geom_text(
            data = df, aes(x = {{ x }}, y = {{ y }}, label = str_to_upper({{ grade }})),
            family = fonts$text, fontface = "bold", size = size,
            color = if_else(pull(df, {{ grade }}) == "shown", "white", col_ink)
        )
    )
}

### |- panel A: one event, two cited passages ----
cards <- tibble(
    side   = c("prose", "adapt"),
    x      = c(0.245, 0.755),
    head   = c("PROSE ORIGINAL", "ADAPTATION"),
    source = c(
        glue("{hero$prose_work}\n{hero$prose_locator}"),
        glue("{hero$adapt_work}\n{hero$adapt_locator}")
    ),
    claim  = c(str_wrap(hero$prose_claim, 30), str_wrap(hero$adapt_claim, 30)),
    grade  = c(hero$prose_confidence, hero$adapt_confidence)
)
card_w <- 0.47
card_bottom <- 0.02
card_top <- 0.66

p_a <- ggplot() +
    # panel heading and decoding cue
    annotate("text",
             x = 0, y = 1.00, hjust = 0, vjust = 1, family = fonts$text, size = 3.6,
             fontface = "bold", color = col_ink, label = "A   One event, two cited passages"
    ) +
    annotate("text",
             x = 0, y = 0.945, hjust = 0, vjust = 1, family = fonts$text, size = 2.9,
             color = col_muted, lineheight = 1.15, label = cue_a
    ) +
    # the event
    annotate("rect",
             xmin = 0.22, xmax = 0.78, ymin = 0.765, ymax = 0.835,
             fill = col_card, color = col_ink, linewidth = 0.4
    ) +
    annotate("text",
             x = 0.5, y = 0.80, family = fonts$text, size = 3.6, fontface = "bold",
             color = col_ink, label = glue("{hero$name} at the {hero$event_label}")
    ) +
    # the branch: the accent marks the change, not a grade
    annotate("segment", x = 0.5, xend = 0.5, y = 0.765, yend = 0.715, color = col_accent, linewidth = 0.9) +
    annotate("segment", x = 0.245, xend = 0.755, y = 0.715, yend = 0.715, color = col_accent, linewidth = 0.9) +
    annotate("segment", x = 0.245, xend = 0.245, y = 0.715, yend = card_top, color = col_accent, linewidth = 0.9) +
    annotate("segment", x = 0.755, xend = 0.755, y = 0.715, yend = card_top, color = col_accent, linewidth = 0.9) +
    # the two cards
    geom_rect(
        data = cards,
        aes(xmin = x - card_w / 2, xmax = x + card_w / 2, ymin = card_bottom, ymax = card_top),
        fill = col_card, color = col_rule, linewidth = 0.5
    ) +
    geom_text(
        data = cards, aes(x = x - card_w / 2 + 0.03, y = card_top - 0.035, label = head),
        hjust = 0, vjust = 1, family = fonts$text, size = 2.6, fontface = "bold", color = col_muted
    ) +
    geom_text(
        data = cards, aes(x = x - card_w / 2 + 0.03, y = card_top - 0.085, label = source),
        hjust = 0, vjust = 1, family = fonts$text, size = 3.1, color = col_ink, lineheight = 1.1
    ) +
    geom_text(
        data = cards, aes(x = x - card_w / 2 + 0.03, y = card_top - 0.215, label = claim),
        hjust = 0, vjust = 1, family = fonts$text, size = 2.75, fontface = "italic",
        color = col_muted, lineheight = 1.2
    ) +
    chip_layer(
        cards |> mutate(cy = card_bottom + 0.075), x, cy, grade,
        w = 0.30, h = 0.075, size = 4.2, border = col_ink, lw = 0.5
    ) +
    scale_x_continuous(limits = c(0, 1), expand = expansion(0)) +
    scale_y_continuous(limits = c(0, 1), expand = expansion(0)) +
    coord_cartesian(clip = "off")

### |- panel B: the whole reviewed pool ----
x_name  <- 0.025
x_event <- 0.27
x_prose <- 0.70
x_adapt <- 0.89
chip_w  <- 0.15
chip_h  <- 0.72
y_top   <- max(group_heads$y) + 1.9

p_b <- ggplot() +
    # panel heading and decoding cue
    annotate("text",
             x = 0, y = y_top + 2.5, hjust = 0, vjust = 1, family = fonts$text, size = 3.6,
             fontface = "bold", color = col_ink, label = head_b
    ) +
    annotate("text",
             x = 0, y = y_top + 1.5, hjust = 0, vjust = 1, family = fonts$text, size = 2.9,
             color = col_muted, lineheight = 1.15, label = cue_b
    ) +
    # column headers
    annotate("text",
             x = c(x_prose, x_adapt), y = y_top - 0.55, label = c("PROSE ORIGINAL", "ADAPTATION"),
             family = fonts$text, size = 2.5, fontface = "bold", color = col_muted
    ) +
    # franchise group headers
    geom_text(
        data = group_heads, aes(x = 0, y = y, label = label),
        hjust = 0, family = fonts$caption, size = 2.4, color = col_muted
    ) +
    # rows: name and event
    geom_text(
        data = ledger, aes(x = x_name, y = y, label = name),
        hjust = 0, family = fonts$text, size = 2.9,
        fontface = if_else(ledger$changed, "bold", "plain"),
        color = if_else(ledger$changed, col_accent, col_ink)
    ) +
    geom_text(
        data = ledger, aes(x = x_event, y = y, label = event_label),
        hjust = 0, family = fonts$text, size = 2.9,
        fontface = if_else(ledger$changed, "bold", "plain"),
        color = if_else(ledger$changed, col_accent, col_muted)
    ) +
    # connector between the two grades
    geom_segment(
        data = ledger,
        aes(x = x_prose + chip_w / 2, xend = x_adapt - chip_w / 2, y = y, yend = y),
        color = if_else(ledger$changed, col_accent, col_rule),
        linewidth = if_else(ledger$changed, 0.9, 0.35)
    ) +
    chip_layer(
        ledger, x_prose, y, prose_confidence,
        w = chip_w, h = chip_h, size = 2.3,
        border = if_else(ledger$changed, col_accent, col_shown),
        lw = if_else(ledger$changed, 0.9, 0.3)
    ) +
    chip_layer(
        ledger, x_adapt, y, adapt_confidence,
        w = chip_w, h = chip_h, size = 2.3,
        border = if_else(ledger$changed, col_accent, col_shown),
        lw = if_else(ledger$changed, 0.9, 0.3)
    ) +
    # partial match, outside the count
    annotate("segment",
             x = 0, xend = 1, y = partial_row$y + 1.15, yend = partial_row$y + 1.15,
             color = col_rule, linewidth = 0.4, linetype = "22"
    ) +
    annotate("text",
             x = 0, y = partial_row$y + 0.6, hjust = 0, family = fonts$caption, size = 2.4,
             color = col_muted, label = "Partial match, not counted"
    ) +
    geom_text(
        data = partial_row, aes(x = x_name, y = y - 0.25, label = name),
        hjust = 0, family = fonts$text, size = 2.9, fontface = "italic", color = col_muted
    ) +
    geom_text(
        data = partial_row, aes(x = x_event, y = y - 0.25, label = event_label),
        hjust = 0, family = fonts$text, size = 2.9, fontface = "italic", color = col_muted
    ) +
    chip_layer(
        partial_row |> mutate(y = y - 0.25), x_prose, y, prose_confidence,
        w = chip_w, h = chip_h, size = 2.3, border = col_shown, lw = 0.3
    ) +
    chip_layer(
        partial_row |> mutate(y = y - 0.25), x_adapt, y, adapt_confidence,
        w = chip_w, h = chip_h, size = 2.3, border = col_shown, lw = 0.3
    ) +
    scale_x_continuous(limits = c(0, 1), expand = expansion(0)) +
    scale_y_continuous(limits = c(partial_row$y - 1, y_top + 2.6), expand = expansion(0)) +
    coord_cartesian(clip = "off")

### |- combine ----
p <- p_a + p_b +
    plot_layout(widths = c(0.82, 1.18)) +
    plot_annotation(
        title = title_text, subtitle = subtitle_text, caption = caption_text,
        theme = weekly_theme
    )
```

### [7. Save]{.smallcaps}

```{r}
#| label: save
#| warning: false

### |- save ----
main_path  <- here::here("data_visualizations", "TidyTuesday", "2026", "tt_2026_45.png")
thumb_path <- here::here("data_visualizations", "TidyTuesday", "2026", "thumbnails", "tt_2026_45.png")

# Full-size version, for the QMD figure
ggview::save_ggplot(plot = p, file   = main_path, width  = fig_w,
    height = fig_h, units  = "in", dpi = fig_dpi)

# Reduced-size thumbnail, for the YAML `image:` field
fs::dir_create(dirname(thumb_path))
magick::image_read(main_path) |>
  magick::image_resize("400") |>
  magick::image_write(thumb_path)
```


#### [8. Session Info]{.smallcaps}

::: {.callout-tip collapse="true"}
##### Expand for Session Info

```{r, echo = FALSE}
#| eval: true
#| warning: false

sessionInfo()
```
:::

#### [9. GitHub Repository]{.smallcaps}

::: {.callout-tip collapse="true"}
##### Expand for GitHub Repo

The complete code for this analysis is available in [`tt_2026_45.qmd`](https://github.com/poncest/personal-website/blob/master/data_visualizations/TidyTuesday/2026/tt_2026_45.qmd).

For the full repository, [click here](https://github.com/poncest/personal-website/).
:::

#### [10. References]{.smallcaps}

::: {.callout-tip collapse="true"}
##### Expand for References
1.  **Data Source:**
    -   TidyTuesday 2026 Week 44: [evidence-graded power rankings of fictional characters](https://github.com/rfordatascience/tidytuesday/blob/main/data/2026/2026-11-10/readme.md)

:::


#### [11. Custom Functions Documentation]{.smallcaps}

::: {.callout-note collapse="true"}
##### 📦 Custom Helper Functions

This analysis uses custom functions from my personal module library for efficiency and consistency across projects.

**Functions Used:**

-   **`fonts.R`**: `setup_fonts()`, `get_font_families()` - Font management with showtext
-   **`social_icons.R`**: `create_social_caption()` - Generates formatted social media captions
-   **`base_theme.R`**: `create_base_theme()`, `extend_weekly_theme()`, `get_theme_colors()` - Custom ggplot2 themes

**Why custom functions?**\
These utilities standardize theming, fonts, and output across all my data visualizations. The core analysis (data tidying and visualization logic) uses only standard tidyverse packages.

**Source Code:**\
View all custom functions → [GitHub: R/utils](https://github.com/poncest/personal-website/tree/master/R)
:::

© 2024–2026 Steven Ponce · Built with R + Quarto

Source Issues