
R version 4.4.1 (2024-06-14 ucrt)
Platform: x86_64-w64-mingw32/x64
Running under: Windows 11 x64 (build 26100)

Matrix products: default


locale:
[1] LC_COLLATE=English_United States.utf8
[2] LC_CTYPE=English_United States.utf8
[3] LC_MONETARY=English_United States.utf8
[4] LC_NUMERIC=C
[5] LC_TIME=English_United States.utf8

time zone: America/New_York
tzcode source: internal

attached base packages:
[1] stats     graphics  grDevices datasets  utils     methods   base

loaded via a namespace (and not attached):
 [1] htmlwidgets_1.6.4 compiler_4.4.0    fastmap_1.2.0     cli_3.6.4
 [5] htmltools_0.5.8.1 tools_4.4.0       rstudioapi_0.17.1 yaml_2.3.10
 [9] rmarkdown_2.29    knitr_1.49        jsonlite_1.8.9    xfun_0.49
[13] digest_0.6.37 rlang_1.1.6 renv_1.0.3 evaluate_1.0.1 Exploring a Century of Meteorite Discoveries
Designing an interactive dashboard to explore 45,716 meteorite landings across 1,150+ years
Shiny
2025
From raw NASA records to interactive insight: a portfolio case study on building a professional R Shiny dashboard to explore global meteorite discoveries.
Explore the project
- 🚀 Live app: https://0l6jpd-steven-ponce.shinyapps.io/Meteorite_Landings/
- 💻 Source code: https://github.com/poncest/Meteorite_Landings
The Opportunity
NASA’s meteorite landings dataset documents 45,716 meteorite discoveries from 860 CE to 2013—over 1,150 years of recorded encounters with material from space.
This project began with a simple goal: turn a large historical dataset into an intuitive, interactive experience that allows users to explore where meteorites were found, how discoveries changed over time, and what distinguishes rare observed falls from later recoveries.
Guiding Questions
To shape the dashboard, I focused on a small set of questions that naturally emerge from the data:
Geography
- Where are meteorite discoveries concentrated globally?
- Why does Antarctica dominate modern records?
Time
- How have discoveries evolved over time?
- What explains the sharp rise in finds after 1970?
Physical Characteristics
- How do observed falls differ from recovered meteorites?
- Which meteorite types appear most frequently?
Design Approach: Progressive Disclosure
The dashboard follows a progressive disclosure strategy: present the big picture first, then allow deeper exploration for users who want it.
Global Overview
The opening view provides immediate context through four headline metrics:
- Total meteorites: 45,716
- Largest find: Hoba (~60 tonnes)
- Time span: 860–2013
- Observed falls: 2.4%
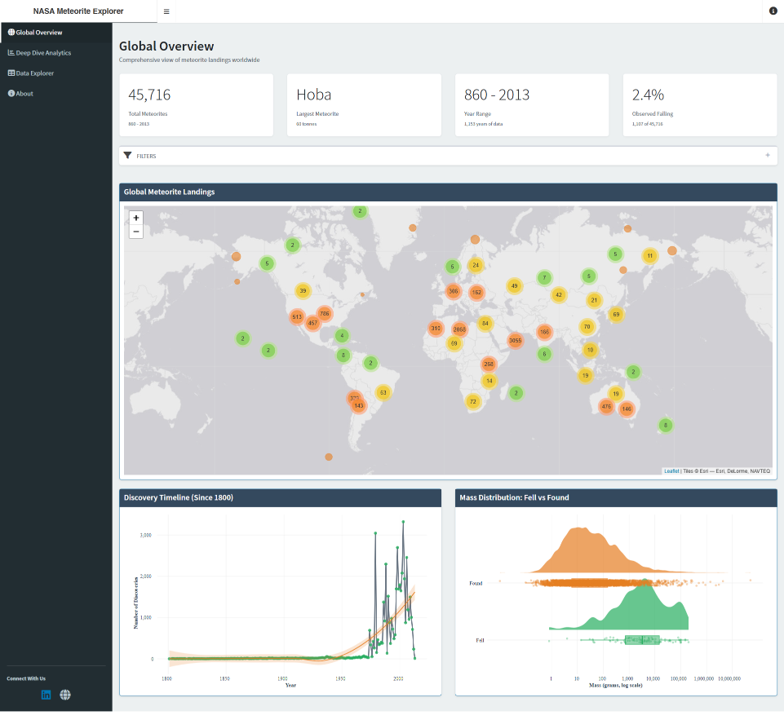
These are paired with three core visualizations:
- Interactive world map showing all meteorite locations with clustering for performance
- Discovery timeline highlighting the rapid increase in finds since the 19th century
- Mass distribution comparing observed falls versus recovered meteorites
A simple year-range filter allows users to focus on specific historical periods without overwhelming the interface.
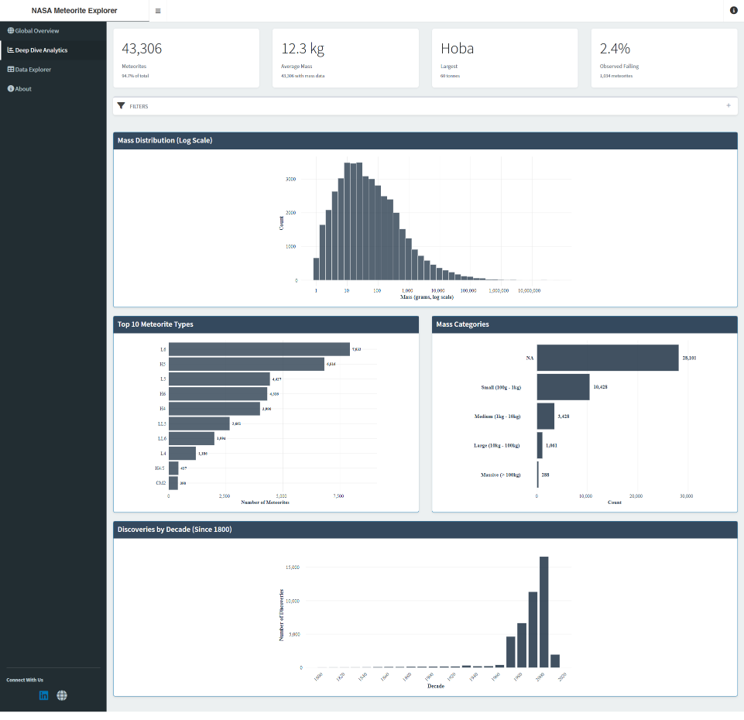
Deep Dive Analytics
For more detailed exploration, the analytics tab adds multidimensional filters:
- Year range
- Mass range (log scale)
- Meteorite classification
- Discovery status (Fell vs. Found)
All visualizations and summary statistics update reactively, allowing users to explore relationships across time, mass, and type.
Data Explorer
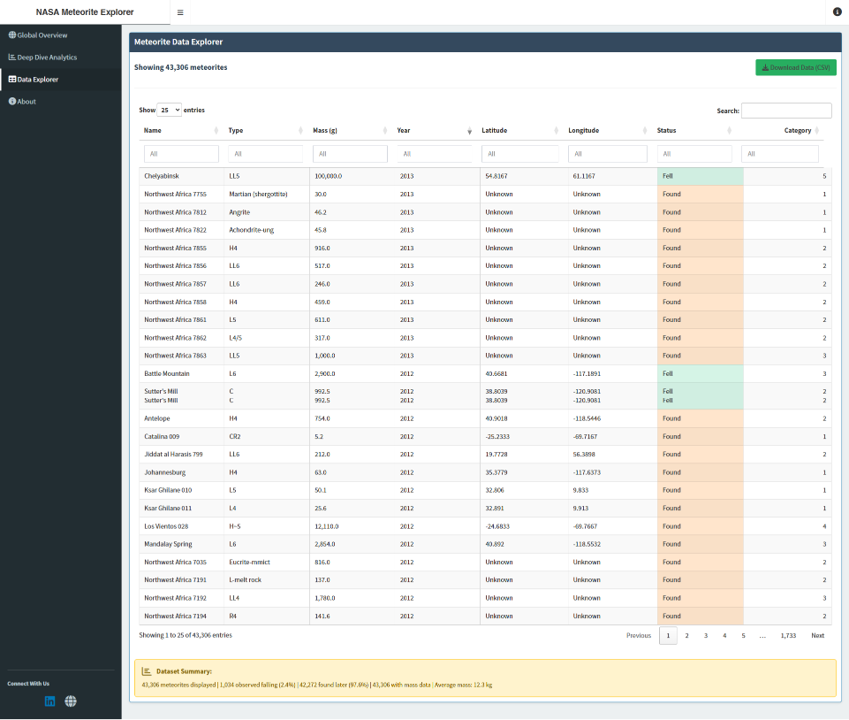
The final tab exposes the underlying dataset through an interactive table, supporting:
- Search and column-level filtering
- Sorting
- CSV export for external analysis
Key Patterns Revealed by the Data
Antarctica’s Outsized Role
Modern meteorite discoveries are dominated by Antarctica. The ice sheet acts as a natural conveyor belt, concentrating meteorites in accessible regions. Dark stones contrast sharply against the ice, and cold, dry conditions preserve specimens exceptionally well.
The Post-1970 Discovery Surge
The dramatic rise in discoveries after 1970 reflects improved search efforts, not an increase in meteorite impacts. Antarctic expeditions, desert surveys, and systematic recovery programs fundamentally changed how meteorites are found.
Fell vs. Found
Only 1,097 meteorites (2.4%) were observed falling. These events are scientifically valuable because their arrival time is precisely known. Recovered meteorites, which make up the remaining 97.6%, are often larger and discovered long after impact.
Design Decisions That Improved Clarity
Consistency Over Color
Early versions of the dashboard used multiple accent colors for value boxes, creating visual noise. Switching to uniform white cards with subtle borders improved readability and gave the dashboard a more professional, consulting-style appearance.
Standardized Layout
Both main tabs follow the same structure:
- Key metrics
- Optional filters
- Detailed charts
This consistency reduces cognitive load and helps users quickly understand how to navigate the dashboard.
Unified Interactivity
All charts use ggiraph for hover-based interaction, ensuring a consistent interaction model across maps, timelines, and distributions.
Technical Overview
TipArchitecture & Stack
The app uses a modular Shiny architecture:
-
UI:
ui_main.R,ui_tabs.R -
Server:
server.R,server_charts.R -
Global setup:
global.R
Core technologies:
R Shiny + shinydashboard
ggiraph (interactive charts)
leaflet (mapping)
DT (data tables)
dplyr / ggplot2 (data manipulation and visualization)
Deployment Lessons
NoteExpand for Deployment Notes
Dependency Management - Spatial packages (terra, raster) require explicit declaration in DESCRIPTION - Indirect dependencies must be captured in renv.lock with renv::snapshot()
Performance Optimization
- Binary data formats (.rds) load ~10x faster than text formats (.csv) - Essential for meeting shinyapps.io’s 60-second startup limit
Reproducibility - Lock all dependencies early to avoid deployment surprises - Test with rsconnect::appDependencies() before deploying
Closing Takeaway
Note
This project reinforced a simple but powerful lesson: effective dashboards are designed, not assembled. Clarity, consistency, and restraint mattered more than adding features — both in code and in communication.
Session Info
TipExpand for Session Info
GitHub Repository
TipExpand for GitHub Repo
References
TipExpand for References
- NASA Meteorite Landings Dataset: https://catalog.data.gov/dataset/meteorite-landings
- Shiny Documentation: https://shiny.posit.co/
- ggiraph: https://davidgohel.github.io/ggiraph/
- Leaflet for R: https://rstudio.github.io/leaflet/
Citation
BibTeX citation:
@online{ponce2025,
  author = {Ponce, Steven},
  title = {Exploring a {Century} of {Meteorite} {Discoveries}},
  date = {2025-12-15},
  url = {https://stevenponce.netlify.app/projects/standalone_visualizations/sa_2025-12-15.html},
  langid = {en}
}
For attribution, please cite this work as:
Ponce, Steven. 2025. “Exploring a Century of Meteorite
Discoveries.” December 15. https://stevenponce.netlify.app/projects/standalone_visualizations/sa_2025-12-15.html.