Clinical Trial Duration Forecasting: A Validation-First Case Study
What time-based validation reveals about oncology trial duration forecasting using registry data

🚀 Live App:
Clinical Trial Duration Forecaster
💻 Source Code:
GitHub repository
My model showed R² = 0.84. Then I validated it properly. The result dropped to 0.04—and that finding became the point.
1. Framing the problem
Forecasting clinical trial timelines is an appealing problem in pharmaceutical analytics. Timelines influence portfolio planning, resourcing, and cross-functional expectations across R&D organizations. At the same time, experienced trial teams recognize that duration is shaped by factors that are difficult to observe early—protocol complexity, enrollment dynamics, site performance, and evolving standards of care.
This project approaches trial duration forecasting as a validation problem first, rather than an optimization exercise. The objective is not to produce an operational forecasting tool, but to evaluate what level of prospective signal is realistically supported by publicly available registry data.
2. What question this analysis tests
The core question is intentionally narrow:
Can ClinicalTrials.gov registry features support prospective forecasting of oncology trial duration?
To answer this, I built an end-to-end modeling pipeline and Shiny dashboard using completed oncology treatment trials. The target variable is registry-defined duration (Start Date → Completion Date), which may include extended follow-up and should not be interpreted as a direct proxy for last-patient–last-visit (LPLV); predictors are limited to information available in the registry at study start.
The emphasis is on aligning validation strategy with intended use, rather than maximizing retrospective fit.
3. When random validation appears convincing
Using a conventional random train/test split, the model appeared to perform well:
- R² ≈ 0.84
- Median absolute error ≈ 7 months
At face value, this resembles performance often reported in exploratory analytics. However, random splits implicitly allow information from later-era trials to influence predictions for earlier-era trials. For a forward-looking use case, this validation strategy is inappropriate.
At this stage, the model was answering the wrong question.
4. What changes under time-based validation
When the validation strategy was changed to reflect prospective use—training on earlier trials and testing on later trials—performance dropped sharply:
| Validation Approach | Test R² | Median Absolute Error |
|---|---|---|
| Random split | 0.84 | 7 months |
| Time-based split | 0.04 | 21 months |
This result reflects two structural realities:
- Temporal drift: Median trial duration decreased substantially across eras, meaning relationships learned from earlier trials do not generalize cleanly to later ones.
- Registry feature limitations: Key drivers of duration—protocol complexity, endpoint strategy, enrollment velocity, and operational execution—are largely absent from ClinicalTrials.gov.
Under these conditions, low prospective R² is not a modeling failure; it is the most honest estimate the data can provide.
5. Why this matters in pharma analytics
In pharmaceutical decision-making, forecasts are used prospectively: to inform planning, resource allocation, and expectations. Validation strategies that mix past and future data can materially overstate confidence and lead to incorrect conclusions.
This case study demonstrates that how a model is validated matters more than which algorithm is chosen. A model that performs well retrospectively but fails under time-based testing may still be useful diagnostically—but it should not be positioned as a forecasting tool.
From an analytics governance perspective, this distinction is critical.
6. What this project does—and does not—claim
This project demonstrates:
- How to design validation strategies that align with prospective use
- How temporal drift can invalidate apparently strong models
- How registry-only features constrain forecasting power
It explicitly does not claim:
- That oncology trial duration is predictable from registry data alone
- That this model should be used for operational timeline planning
- That algorithmic complexity would resolve the observed limitations
The results are conditional on the data sources and features used.
7. What would be required for planning-grade forecasting
If the objective were operational forecasting, additional data would be required, including:
- Protocol complexity and amendment history
- Endpoint structure and follow-up requirements
- Enrollment trajectory and screen-failure dynamics
- Site and geography-level performance history
- Competitive and standard-of-care context
These factors are typically available only through internal systems, not public registries.
Dashboard Preview
The dashboard is structured to make validation behavior visible and to discourage overinterpretation of point predictions.
Executive Brief Surfaces key metrics (R², MAE, sample size) with appropriate caveats about prospective use limitations. 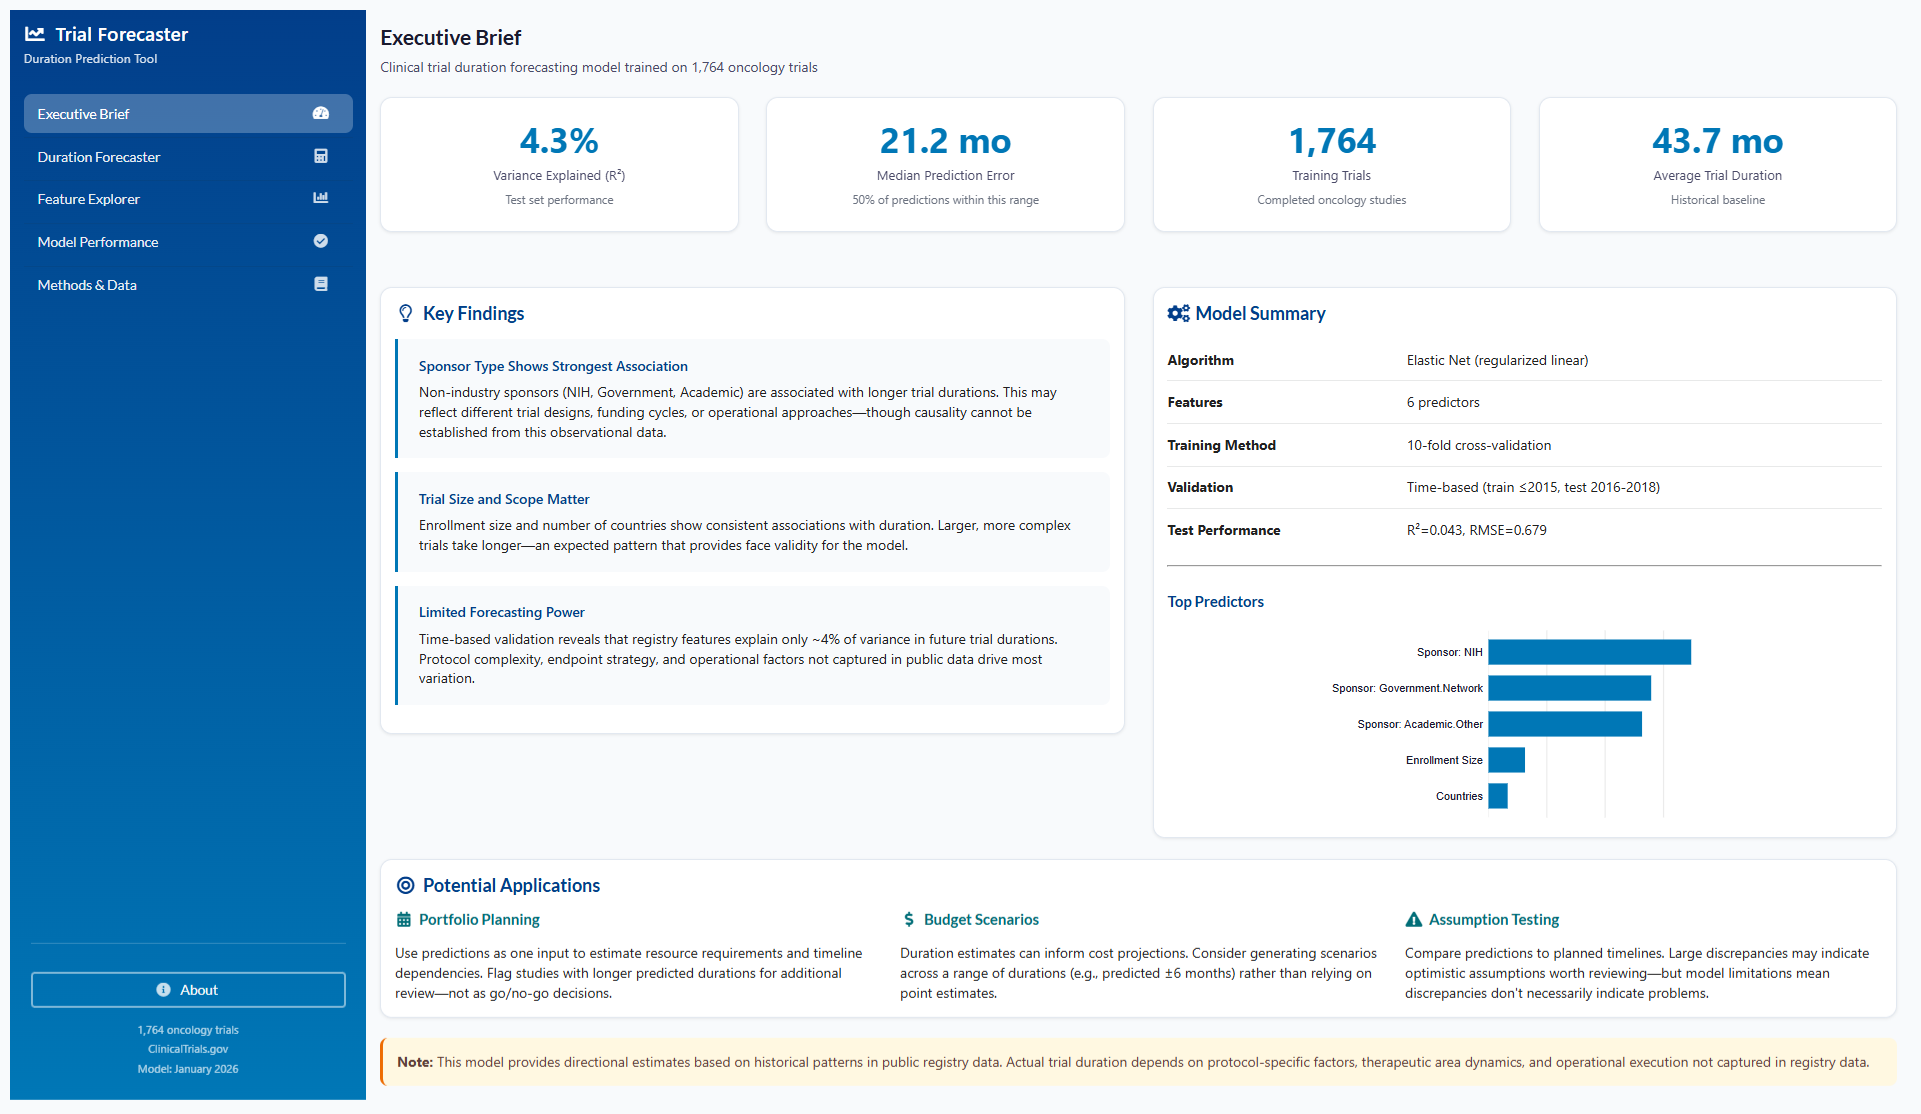
Duration Forecaster Interactive scenario sandbox for exploring how trial characteristics relate to predicted duration—positioned as educational, not operational. 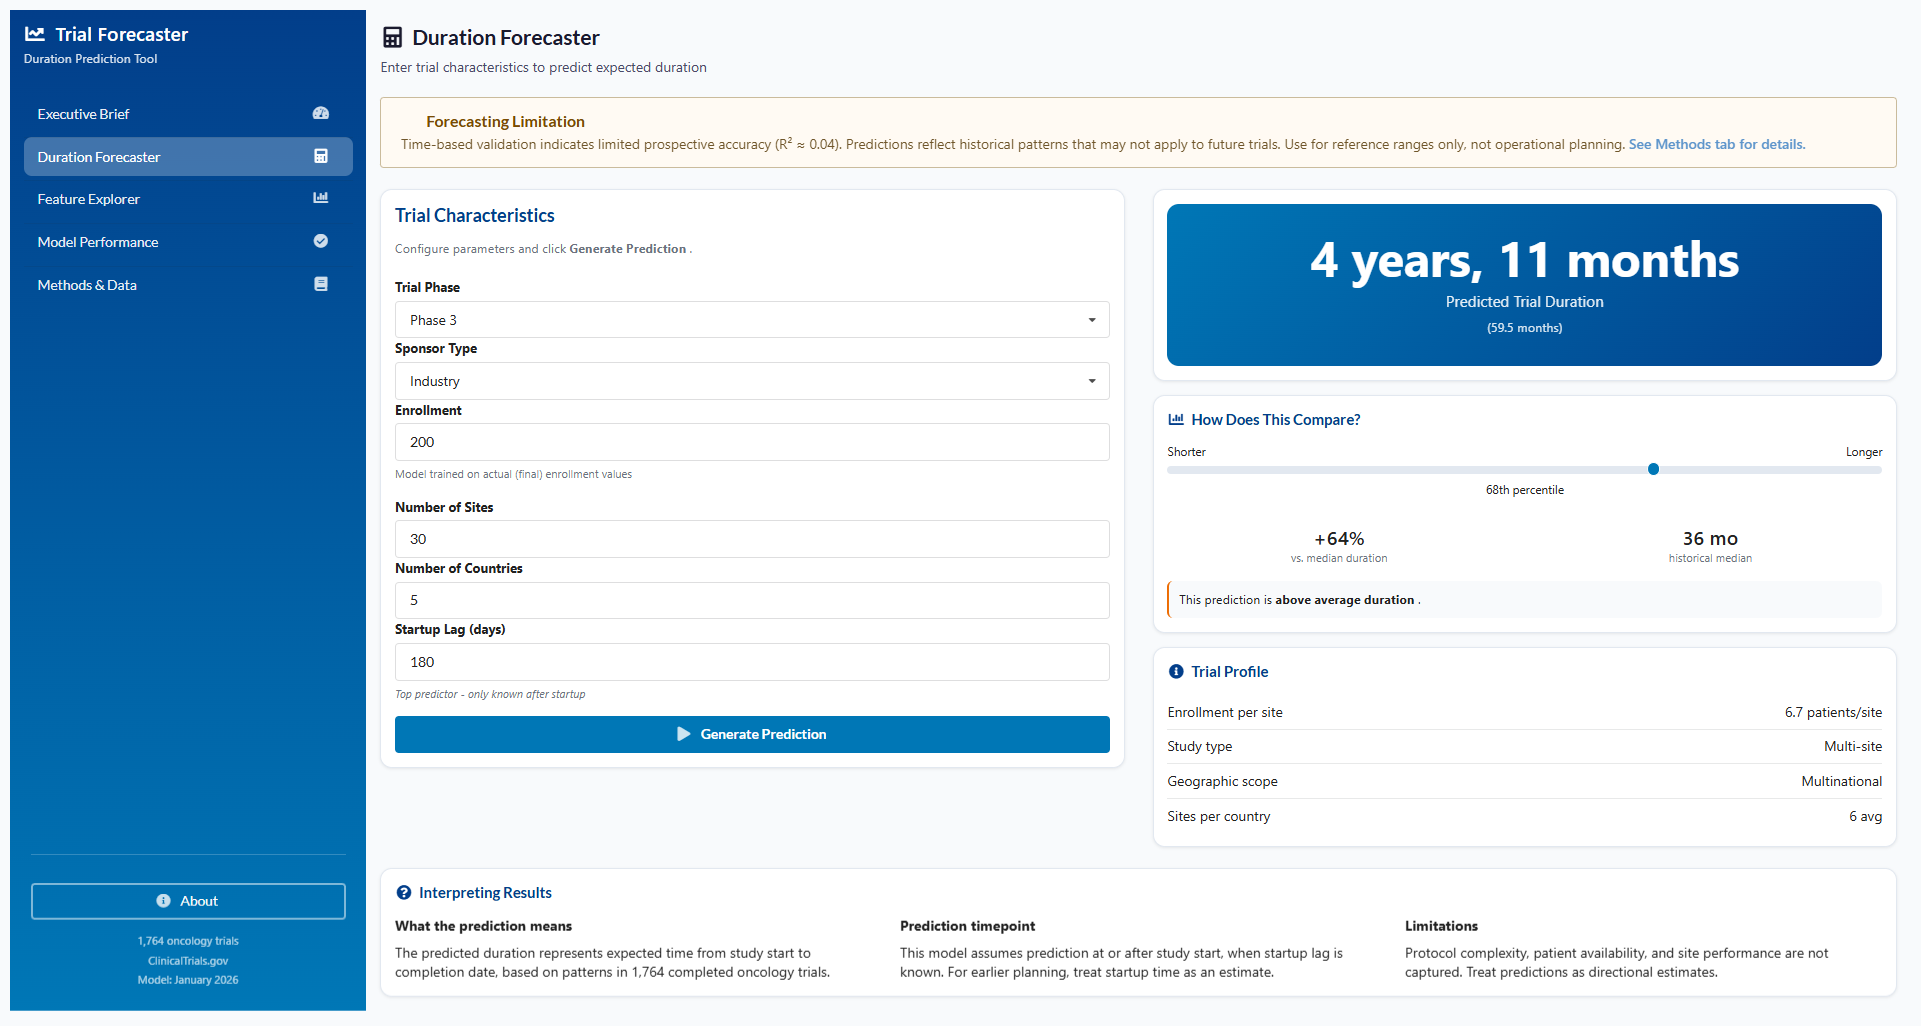
Feature Explorer Visualizes Elastic Net coefficients and feature distributions to understand which registry variables the model weighted. 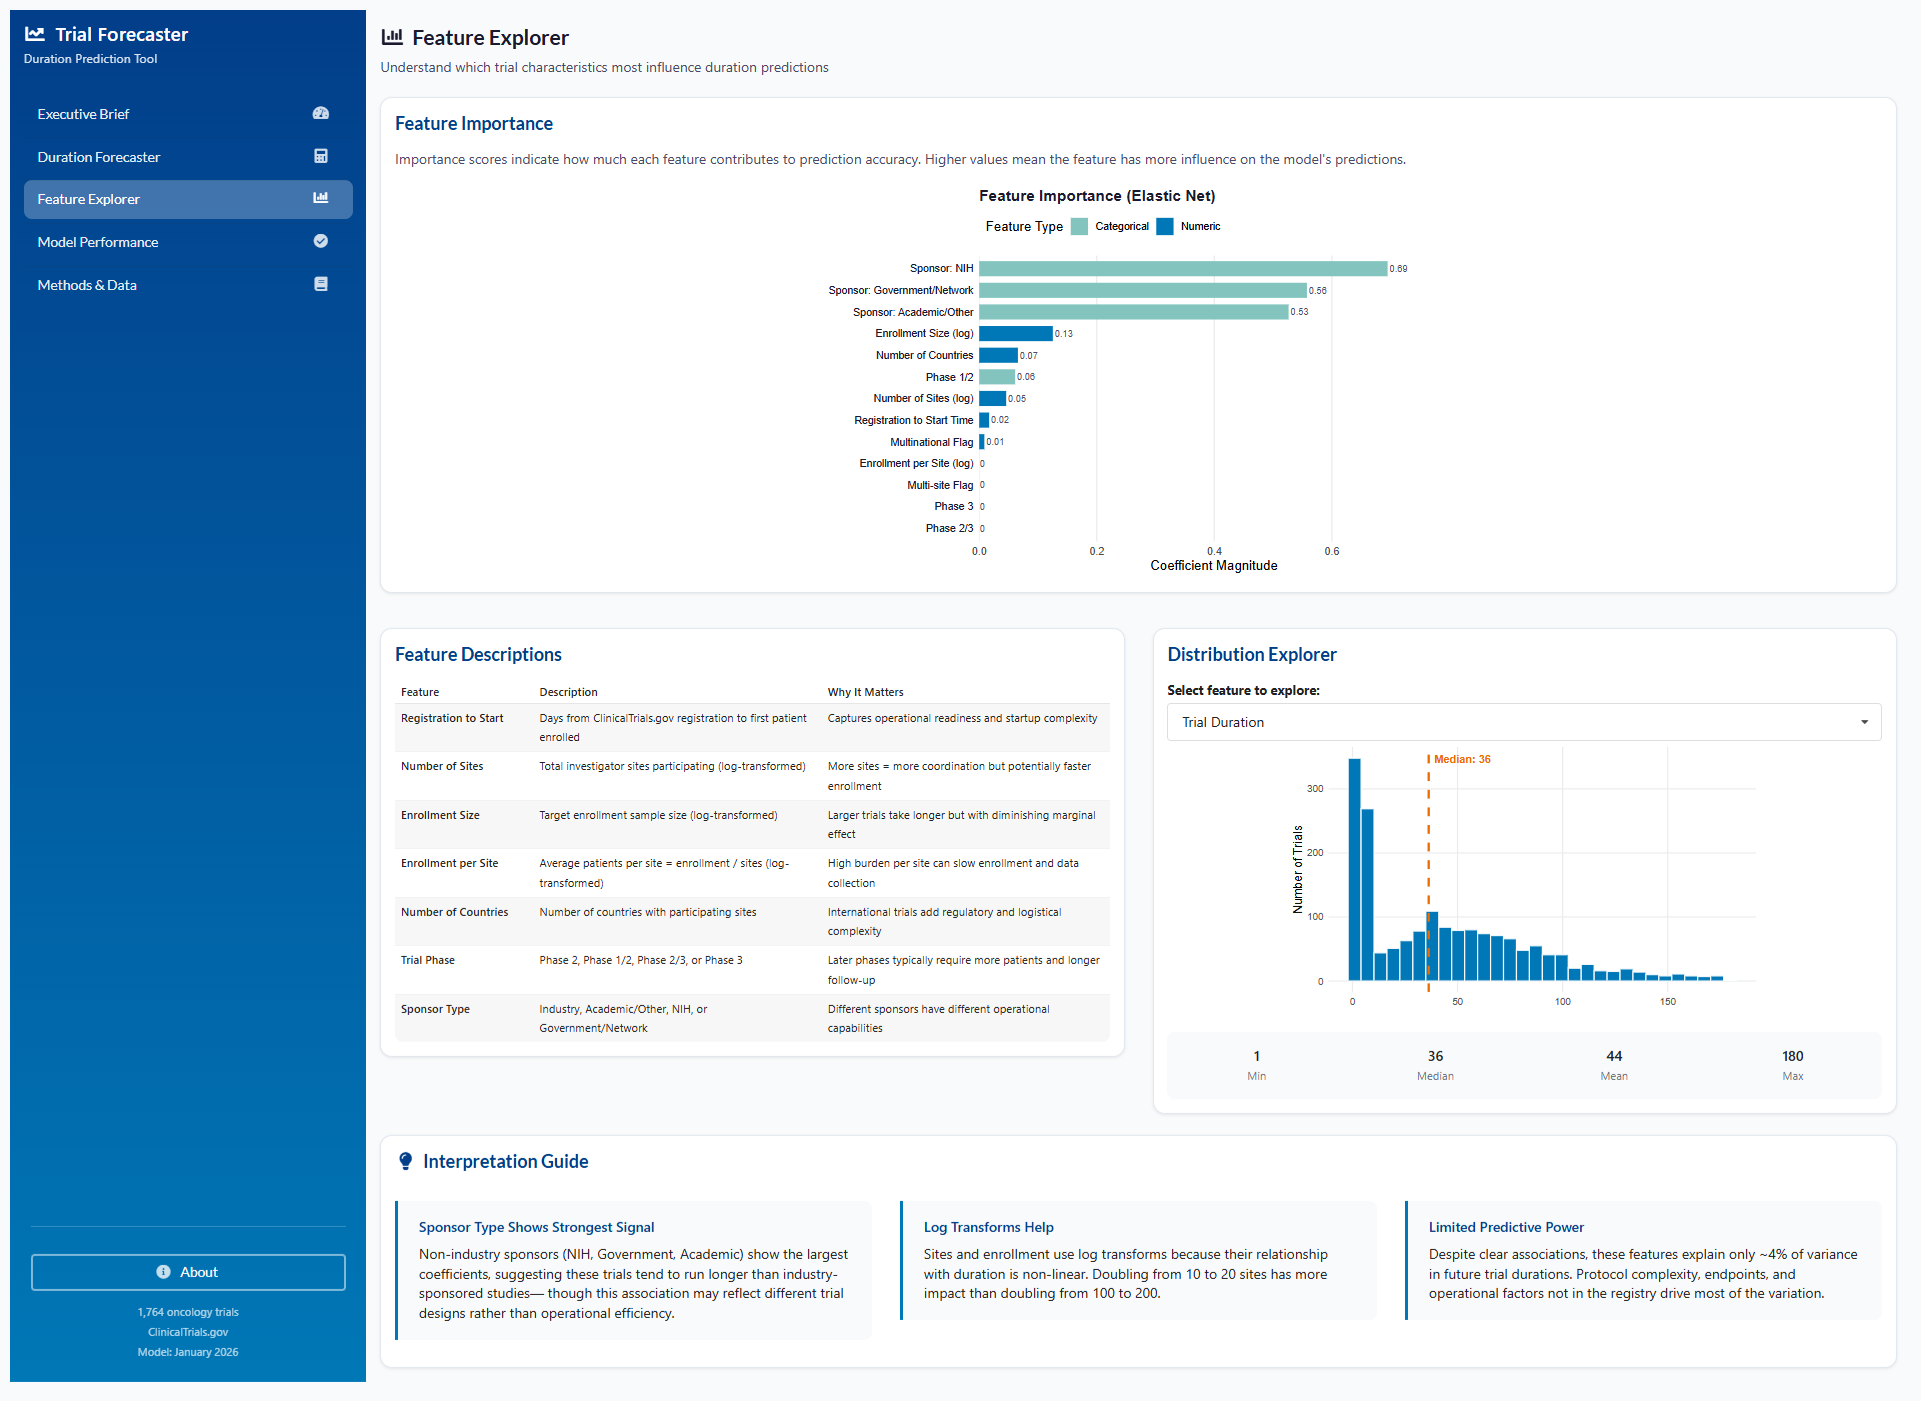
Model Performance Diagnostic plots comparing actual vs. predicted duration, with error breakdown by phase and sponsor type. 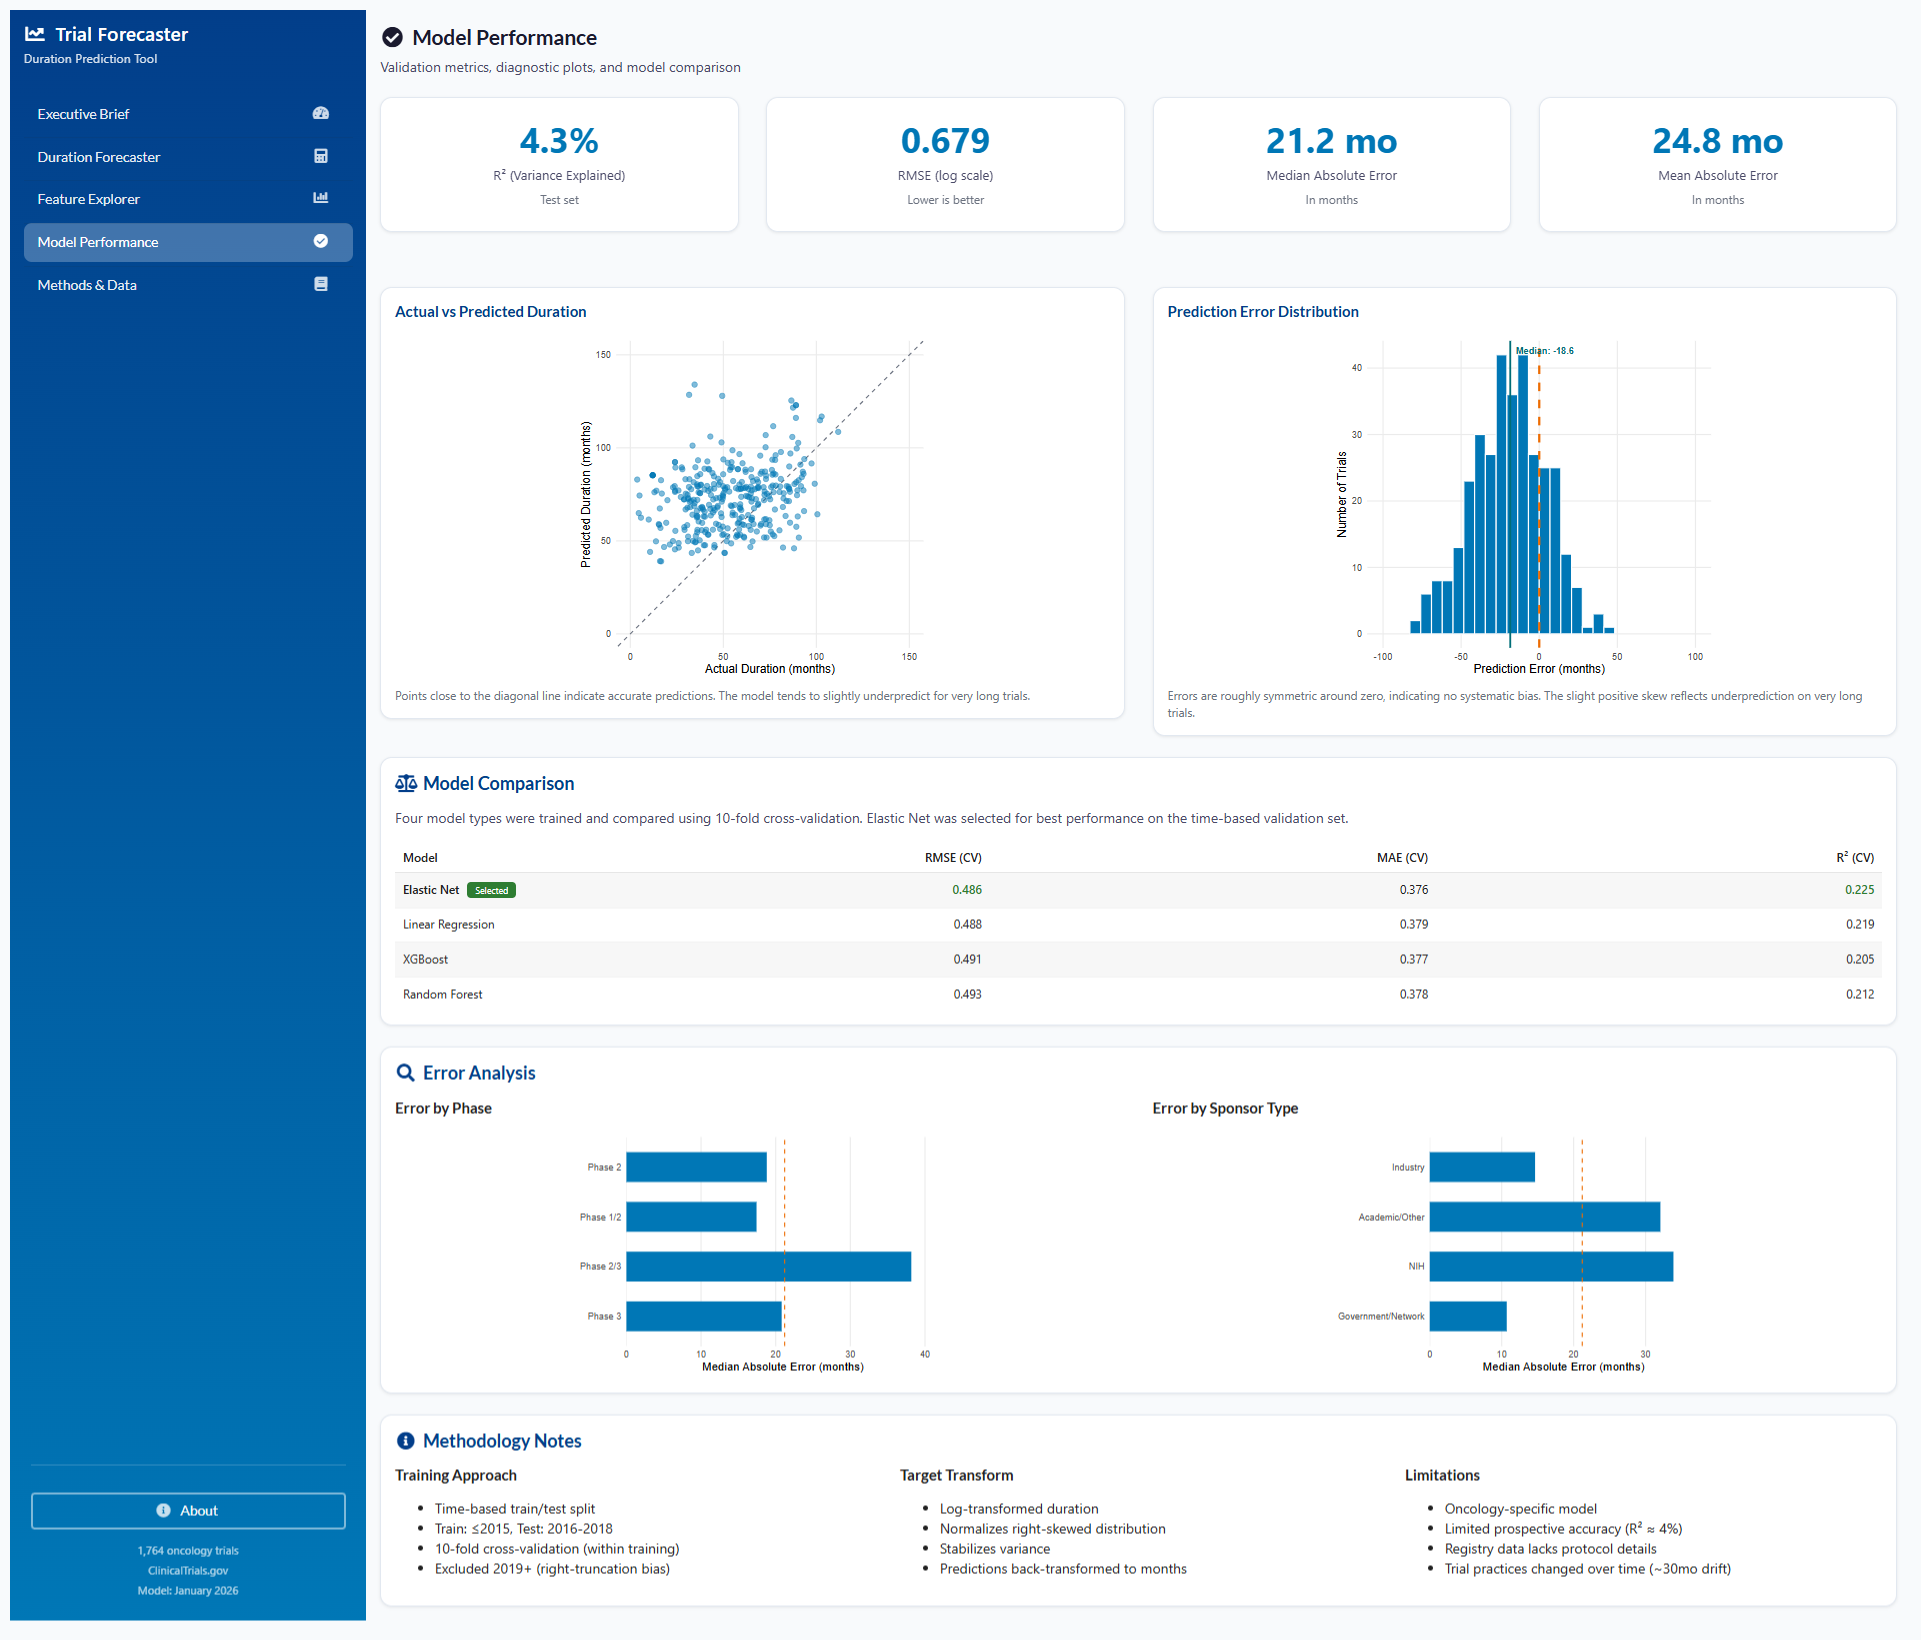
Methods & Data Documents the data pipeline, inclusion criteria, and validation methodology—including the key lesson on why time-based validation matters. 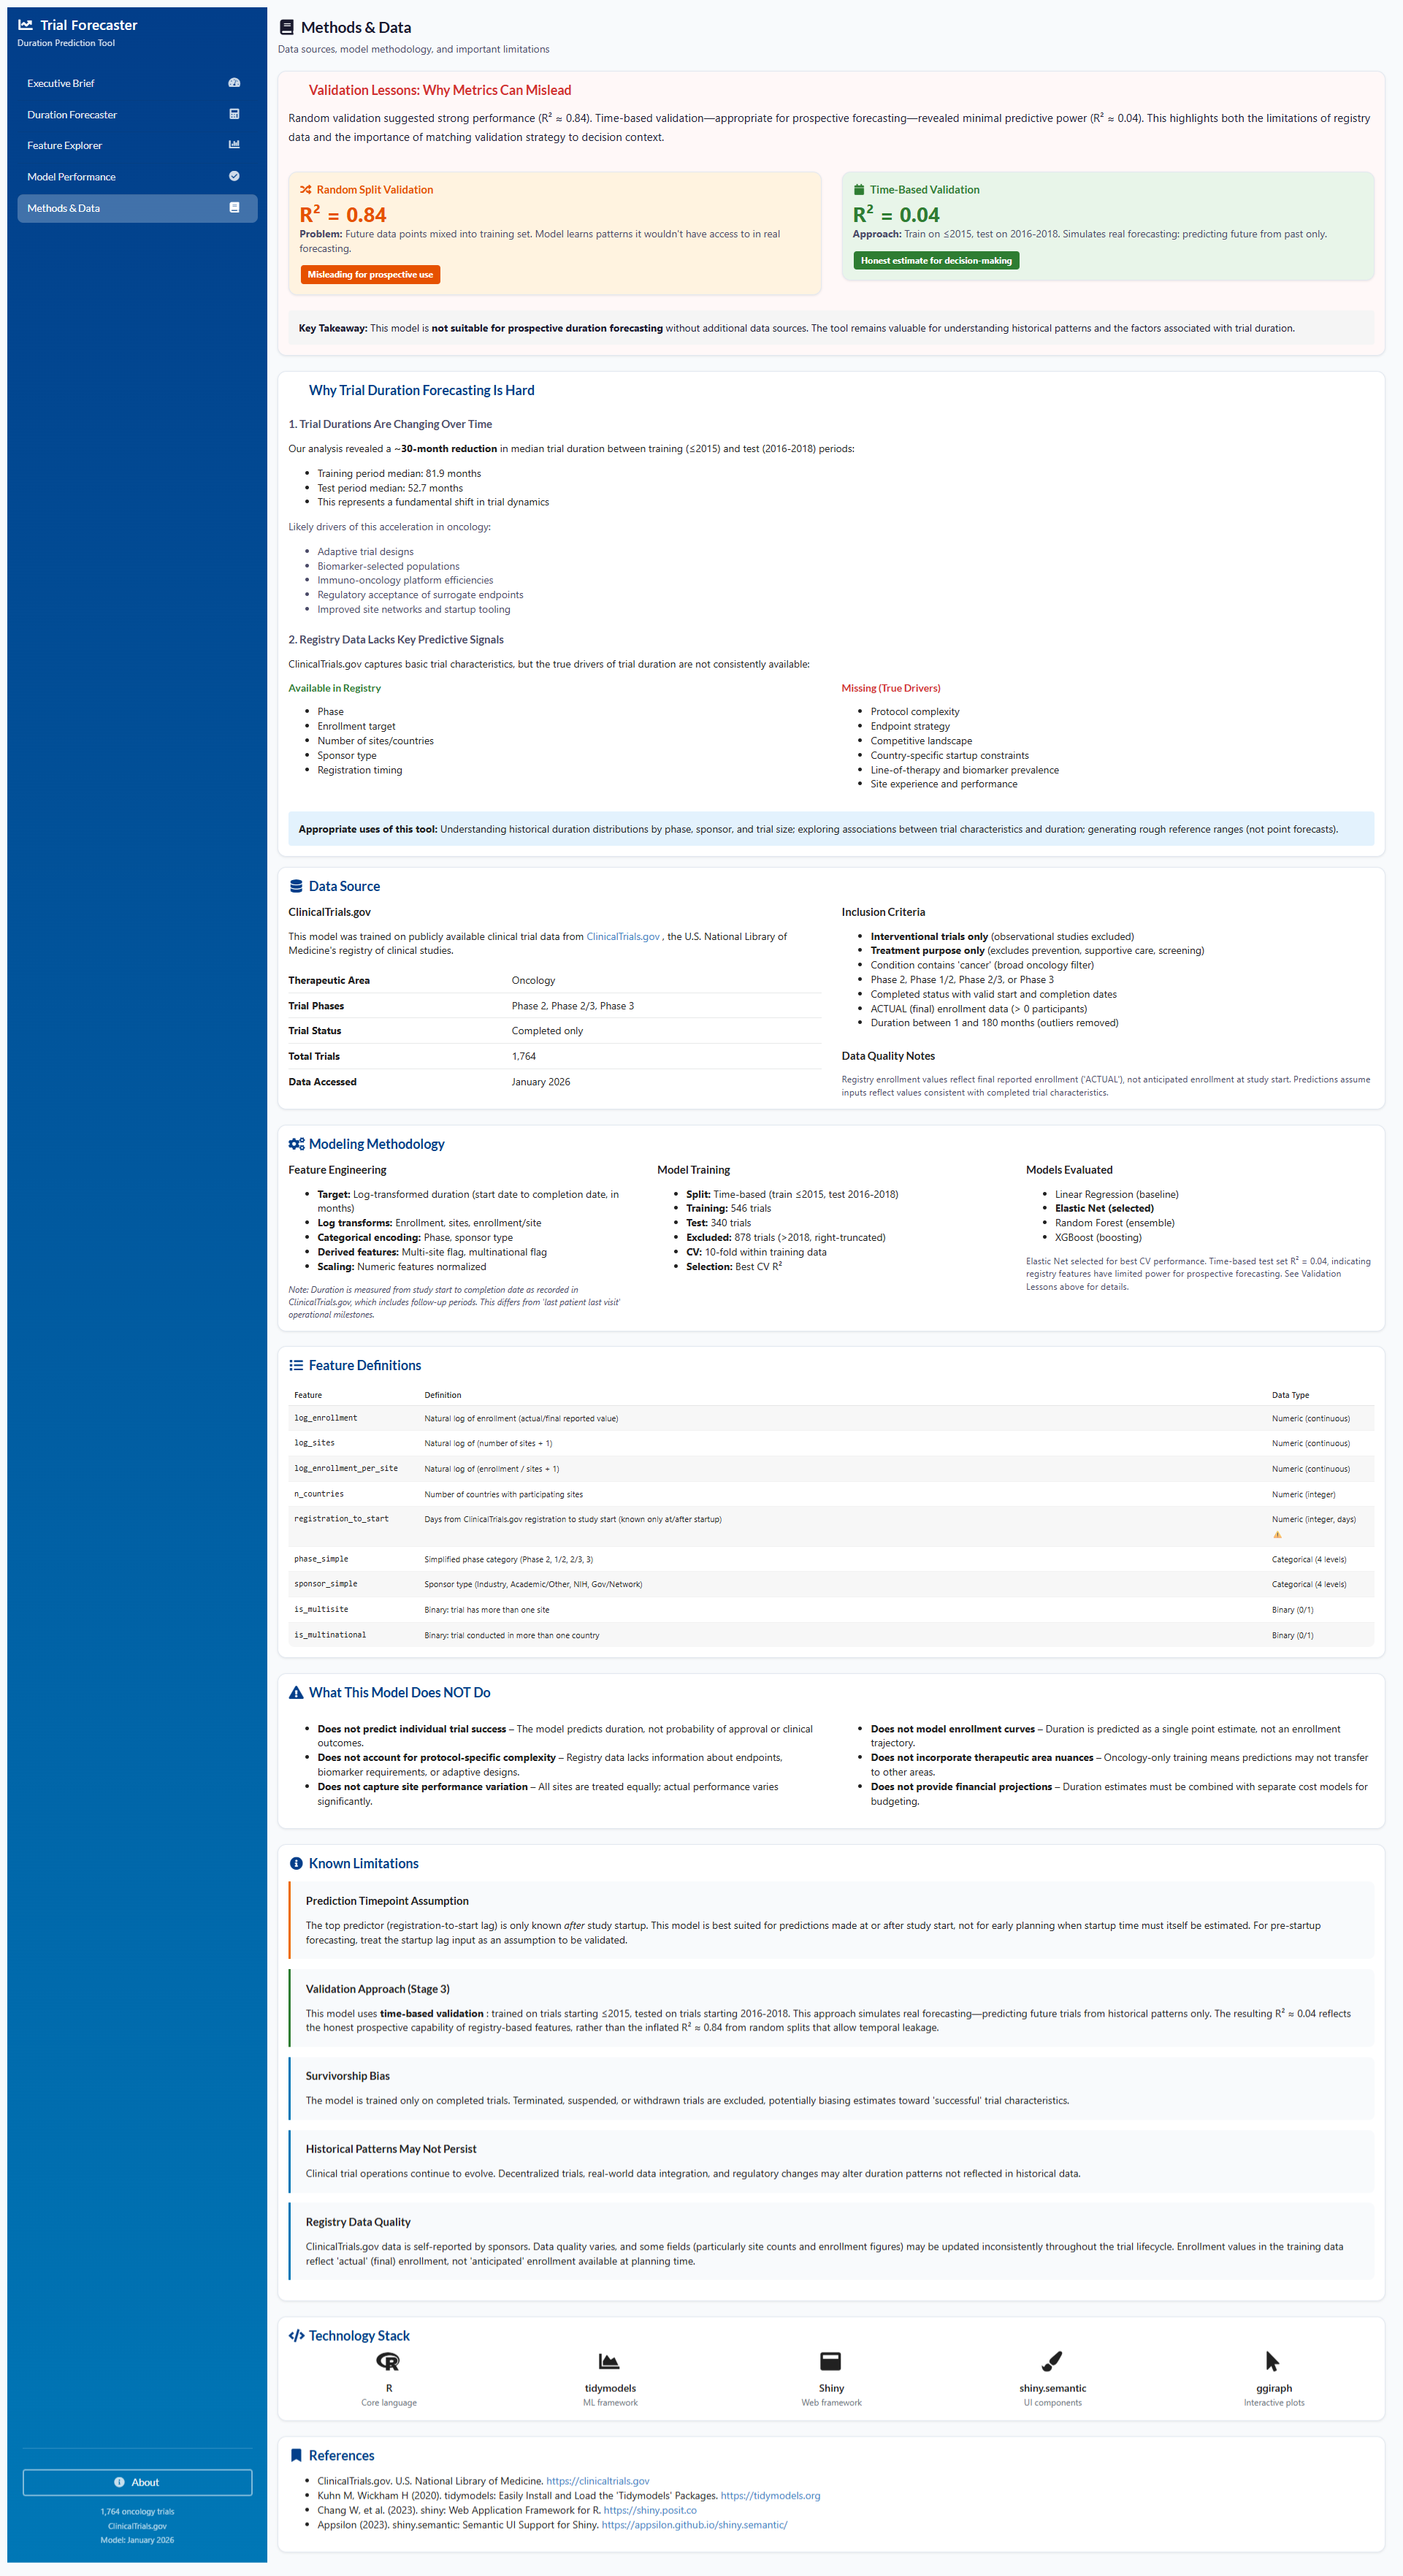
Appendix: Methodology & Build Notes
Analytical Pipeline
- Data acquisition – ClinicalTrials.gov API (oncology interventional trials)
- Cohort filtering – Treatment purpose, Phase 2–3, completed studies
- Feature engineering – Log transforms, ratios, categorical encoding
- Validation design – Time-based split aligned to prospective use
- Modeling – Elastic Net regression via tidymodels
- Diagnostics – Error analysis and residual inspection
Model specification
- Algorithm: Elastic Net (glmnet)
- Target: Log-transformed duration (months)
- Cross-validation: 10-fold CV within training data only
- Baseline comparisons: Linear regression, Random Forest, XGBoost
- Selection criterion: Stability, interpretability, and behavior under time-based validation
Technical stack
- Language: R
- Framework: Shiny (modular architecture)
- UI: shiny.semantic (Appsilon)
- Modeling: tidymodels
- Visualization: ggplot2, ggiraph, reactable
- Deployment: shinyapps.io
References
- ClinicalTrials.gov – U.S. National Library of Medicine
- Tidymodels documentation – https://www.tidymodels.org/
- Appsilon shiny.semantic – https://appsilon.github.io/shiny.semantic/
- Wong, C.H., Siah, K.W., & Lo, A.W. (2019). Estimation of clinical trial success rates and related parameters. Biostatistics, 20(2), 273–286.
Closing reflection
The most important outcome of this project is not a performance metric, but a methodological lesson: honest validation protects decision-makers from false confidence.
In trial analytics, recognizing the limits of available data is as important as extracting signal from it.
Citation
@online{ponce2026,
  author = {Ponce, Steven},
  title = {Clinical {Trial} {Duration} {Forecasting:} {A}
    {Validation-First} {Case} {Study}},
  date = {2026-01-19},
  url = {https://stevenponce.netlify.app/projects/standalone_visualizations/sa_2026-01-19.html},
  langid = {en}
}