Steven Ponce home pageSteven Ponce home page Steven Ponce
  • About
  • Data Visualizations
  • Projects
  • Behind the Viz
  • Resume
  • Email

On this page

  • 1. Framing the problem
  • 2. The core decision question
  • 3. Why governance-first analog selection
  • 4. What the framework quantifies
    • Delay Exposure
    • Product Mode: Analogs as Shapes
    • Scenario Bands from Analog Variation
    • Selection Statistics
  • 5. Key assumptions documented
  • 6. What this framework does—and does not—do
    • What it does
    • What it does not do
  • 7. Dashboard structure
    • Executive Brief
    • Scenario Builder
    • Analog Explorer
    • Methods & Data
  • 8. The analog set
  • 9. Technical lessons from the build
    • The Problem
    • The Solution
  • 10. Why this framing matters for commercial analytics
  • Appendix: Methodology & Build Notes
    • Data Sources
    • Technical Stack
    • Key Design Choices
  • Purpose, Scope, and Disclaimer
  • Closing Reflection

Governance-First Launch Forecasting: A Decision Support Framework

Quantifying revenue risk from launch timing uncertainty using analog-based scenario analysis

Shiny
Pharma & Healthcare
2026
A case study in building decision support for pharmaceutical commercial planning—using governance-first analog selection, transparent assumptions, and explicit trade-off framing to quantify revenue at risk under launch timing uncertainty.
Author

Steven Ponce

Published

January 28, 2026

🚀 Live app:
Oncology Launch Curve Forecaster

💻 Source code:
GitHub repository

WarningData correction (October 2026, original ten analogs)

All 60 revenue values behind the original ten analog curves were re-checked against the companies’ own reports: 35 changed, and 55 are now verified against a primary source. The original dataset had Tecentriq in Swiss francs labeled as US dollars, an Imbruvica series that mixed two definitions, and several values that did not match the filings (Calquence 2019, for example, was $164M reported vs $372M stored). Each value now carries its source and verification status in the repository, and the dashboard figures are recomputed from the corrected data.

NoteAnalog set expanded (October 2026)

The original ten analogs were all prominent launches, so the bands overstated a typical launch. Every new oncology molecular entity first approved by the FDA in 2013–2017 was then screened (56 products), and the set grew to 30 analogs, including modest launches and one withdrawn drug. The median (P50) Year-5 revenue fell from about $4.3B to $981M. The figures below use the 30-analog set.


The core challenge in launch planning isn’t predicting success—it’s quantifying how much uncertainty costs when timing shifts.


1. Framing the problem

Pre-launch planning in pharmaceutical commercialization involves decisions under substantial uncertainty. Brand teams must commit to launch timing, resource allocation, and forecast ranges while facing unknowns about regulatory approval timing, manufacturing readiness, and market reception.

The natural instinct is to seek precision: better models, more data, tighter confidence intervals. But in practice, the harder problem is often structuring the conversation around forecast ranges, revenue-at-risk, and timing shifts—rather than eliminating uncertainty entirely.

This project approaches launch forecasting as a governance and framing problem, rather than a prediction exercise. The objective is not to forecast whether a specific launch will succeed, but to quantify how analog selection and timing assumptions translate into revenue risk—making trade-offs explicit for cross-functional discussion.

In practice, this means shifting the question from “What will happen?” to “What are we implicitly assuming—and what does that assumption cost if it’s wrong?”


2. The core decision question

The framework is designed around a single, actionable question:

What is the revenue at risk if launch timing shifts under uncertainty?

This question matters because it connects analytical work directly to decisions that leadership teams actually face:

  • How much revenue exposure exists in Year 1 if launch slips by one or two quarters?
  • What forecast commitment range (P25/P50/P75) is defensible given analog variation?
  • How sensitive are these conclusions to which analogs are included?

In practice, timing assumptions also propagate into manufacturing readiness, commercial resourcing, and financial guidance—making early uncertainty costly to unwind later.

Rather than producing point forecasts, the framework surfaces ranges and trade-offs that support structured executive discussion.


3. Why governance-first analog selection

Analog-based forecasting is common in pharmaceutical commercial planning. The challenge is that analog selection is inherently subjective—and post-hoc adjustments can undermine credibility.

This framework applies a governance-first methodology:

  1. Define inclusion criteria before examining outcomes — Therapeutic area, launch window, and data availability requirements are specified upfront. Filters that look at outcomes (a minimum Year-5 revenue, excluding the top analog) are offered only as sensitivity checks.
  2. Record the analog list — The app does not enforce this, since anyone can change a selection and see the results. Instead, the Scenario Builder exports a dated scenario record: criteria, included and excluded products with the reason for each exclusion, whether an outcome-based filter was on, the data version, inputs, results and a free-text rationale. That record is what gets filed with the approval, which happens outside the app.
  3. Document rationale for every inclusion/exclusion — Every one of the 56 screened drugs has a recorded keep/drop reason, which creates an audit trail for reviewers.
  4. Test sensitivity explicitly — Option to exclude the top-performing analog tests whether conclusions depend on outliers.

This approach addresses a common critique of analog analysis: that analysts cherry-pick comparators to support predetermined conclusions. By separating selection criteria from outcome examination, the framework survives skeptical review.

This governance-first approach is operationalized in the app through four components: Executive Brief (scenario comparison and trade-off framing), Scenario Builder (criteria configuration and sensitivity testing), Analog Explorer (individual product examination with guardrails), and Methods & Data (assumption documentation and scope boundaries).


4. What the framework quantifies

Delay Exposure

A delay usually does not move the patent or exclusivity end date. The months lost at launch are therefore lost at the end of exclusivity, not simply shifted later. The framework shows that exposure next to the smaller amount of first-year sales that is only deferred:

Delay exposure (fixed exclusivity end) = delay_quarters / 4 × median Year-5 revenue
Deferred first-year sales              = delay_quarters × (median Year-1 revenue / 4)

For a two-quarter delay across all 30 analogs, the exposure is about $490M, against about $87M of first-year sales deferred. The exposure figure assumes the Year-5 run rate applies to the final quarters of exclusivity, often ten or more years after launch. Sales then could be higher (continued growth) or lower (competition, label changes), so it is an exposure estimate, not a bound. A full comparison would value the delayed and on-time revenue paths over the same calendar horizon. Share lost to earlier competitors is not modeled.

Product Mode: Analogs as Shapes

Even a complete analog set’s dollar figures say little about a specific product. In practice, analogs supply the shape of a launch, and the size comes from the product’s own forecast. The Scenario Builder therefore takes an optional expected Year-5 revenue. Each analog’s curve is divided by its own Year-5 revenue, and the shapes are scaled to that figure. For an expected $1B at Year 5, the median shape implies about $129M in Year 1 (P25–P75: $91M–$232M), and a two-quarter delay exposes about $500M at the end of exclusivity. Lartruvo, withdrawn before Year 5, has no defined shape and is left out of this mode.

This is explicitly labeled as a Year 1 average-quarter approximation—a simplification that provides directional magnitude without implying DCF-level precision.

Scenario Bands from Analog Variation

Percentile bands (P25/P50/P75) are derived from observed analog performance:

  • P50: historical median of the selected analogs
  • P25 / P75: historical interquartile range

These represent observed variation across analogs, not statistical confidence intervals, and P50 is not a 50% probability for a new product. The distinction matters: they quantify historical heterogeneity, not forecasting uncertainty. The median curve also joins each year’s median, which can come from different products, so it summarizes the set rather than tracing a launch that happened; the chart shows how many analogs sit behind each year (26 to 30).

Revenue figures describe Year-5 revenue, not a lifetime peak. Every analog is observed for five years after approval, and most were still growing at Year 5. Labeling that value “peak” would understate products like Keytruda, whose revenue kept climbing well beyond the observation window.

Selection Statistics

Dynamic statistics update as criteria change:

  • Solid tumor vs. hematology count
  • Approval year range
  • Median Year-5 revenue
  • Number of analogs meeting criteria

This transparency helps users understand what’s driving the scenario range.


5. Key assumptions documented

The framework relies on several simplifying assumptions that users should understand:

Demand deferral, not destruction
Delayed demand is assumed to shift forward in time rather than being permanently lost. Competitive dynamics and access erosion are not modeled.

Label expansion bias
Some analogs experienced significant post-launch indication expansions, creating potential upward bias in Year-5 revenue estimates. Products without similar expansion potential may underperform these benchmarks.

Era effects
The analog set covers FDA approvals from 2013 to 2017 only. Launches after 2018 face different conditions (pricing pressure, value-based contracting, more crowded classes), which this set does not represent.

Data availability
Sixteen eligible drugs were dropped because their owner did not report their sales separately for every year, or because ownership changed in the first five years. They include small launches (Farydak, Odomzo) and large ones (Tafinlar + Mekinist, Zejula), so the direction and size of any remaining bias are unknown. Five launch years are also missing (for example Kadcyla’s first two), so early-year percentiles rest on 26–29 analogs.

Worldwide revenue and launch-year alignment
Values are company-reported worldwide product sales, converted to US dollars at Federal Reserve average rates; geographic mix differences are not adjusted. Launch Year 1 is the 12 months after each drug’s FDA approval date. Companies report by fiscal year, so each annual total is spread evenly over its days and split across the launch years it overlaps. Sales usually grow within a year, so early launch years are slightly overstated. Worldwide sales are aligned to the US approval date, so a drug sold elsewhere first (Alecensa in Japan from 2014) has higher early launch years, and one launched outside the US later has lower ones.

These assumptions are documented in the Methods & Data tab and surfaced in the dashboard interface to prevent over-interpretation.


6. What this framework does—and does not—do

What it does

✅ Structures analog-based launch scenario analysis
✅ Quantifies revenue ranges from analog variation (P25/P50/P75)
✅ Supports structured trade-off conversations under uncertainty
✅ Documents assumptions and limitations transparently
✅ Provides sensitivity checks to test analytical robustness

What it does not do

❌ Predict whether a specific launch will succeed
❌ Recommend specific investment or resourcing levels
❌ Model competitive response or market access dynamics
❌ Estimate NPV or financial returns
❌ Replace clinical, regulatory, or strategic judgment

By design: NPV and market access modeling are excluded because they require company-specific inputs that would compromise generalizability. Revenue scenarios are treated as foundational inputs to financial modeling, not final outputs.


7. Dashboard structure

The application is organized into four complementary views:

Executive Brief
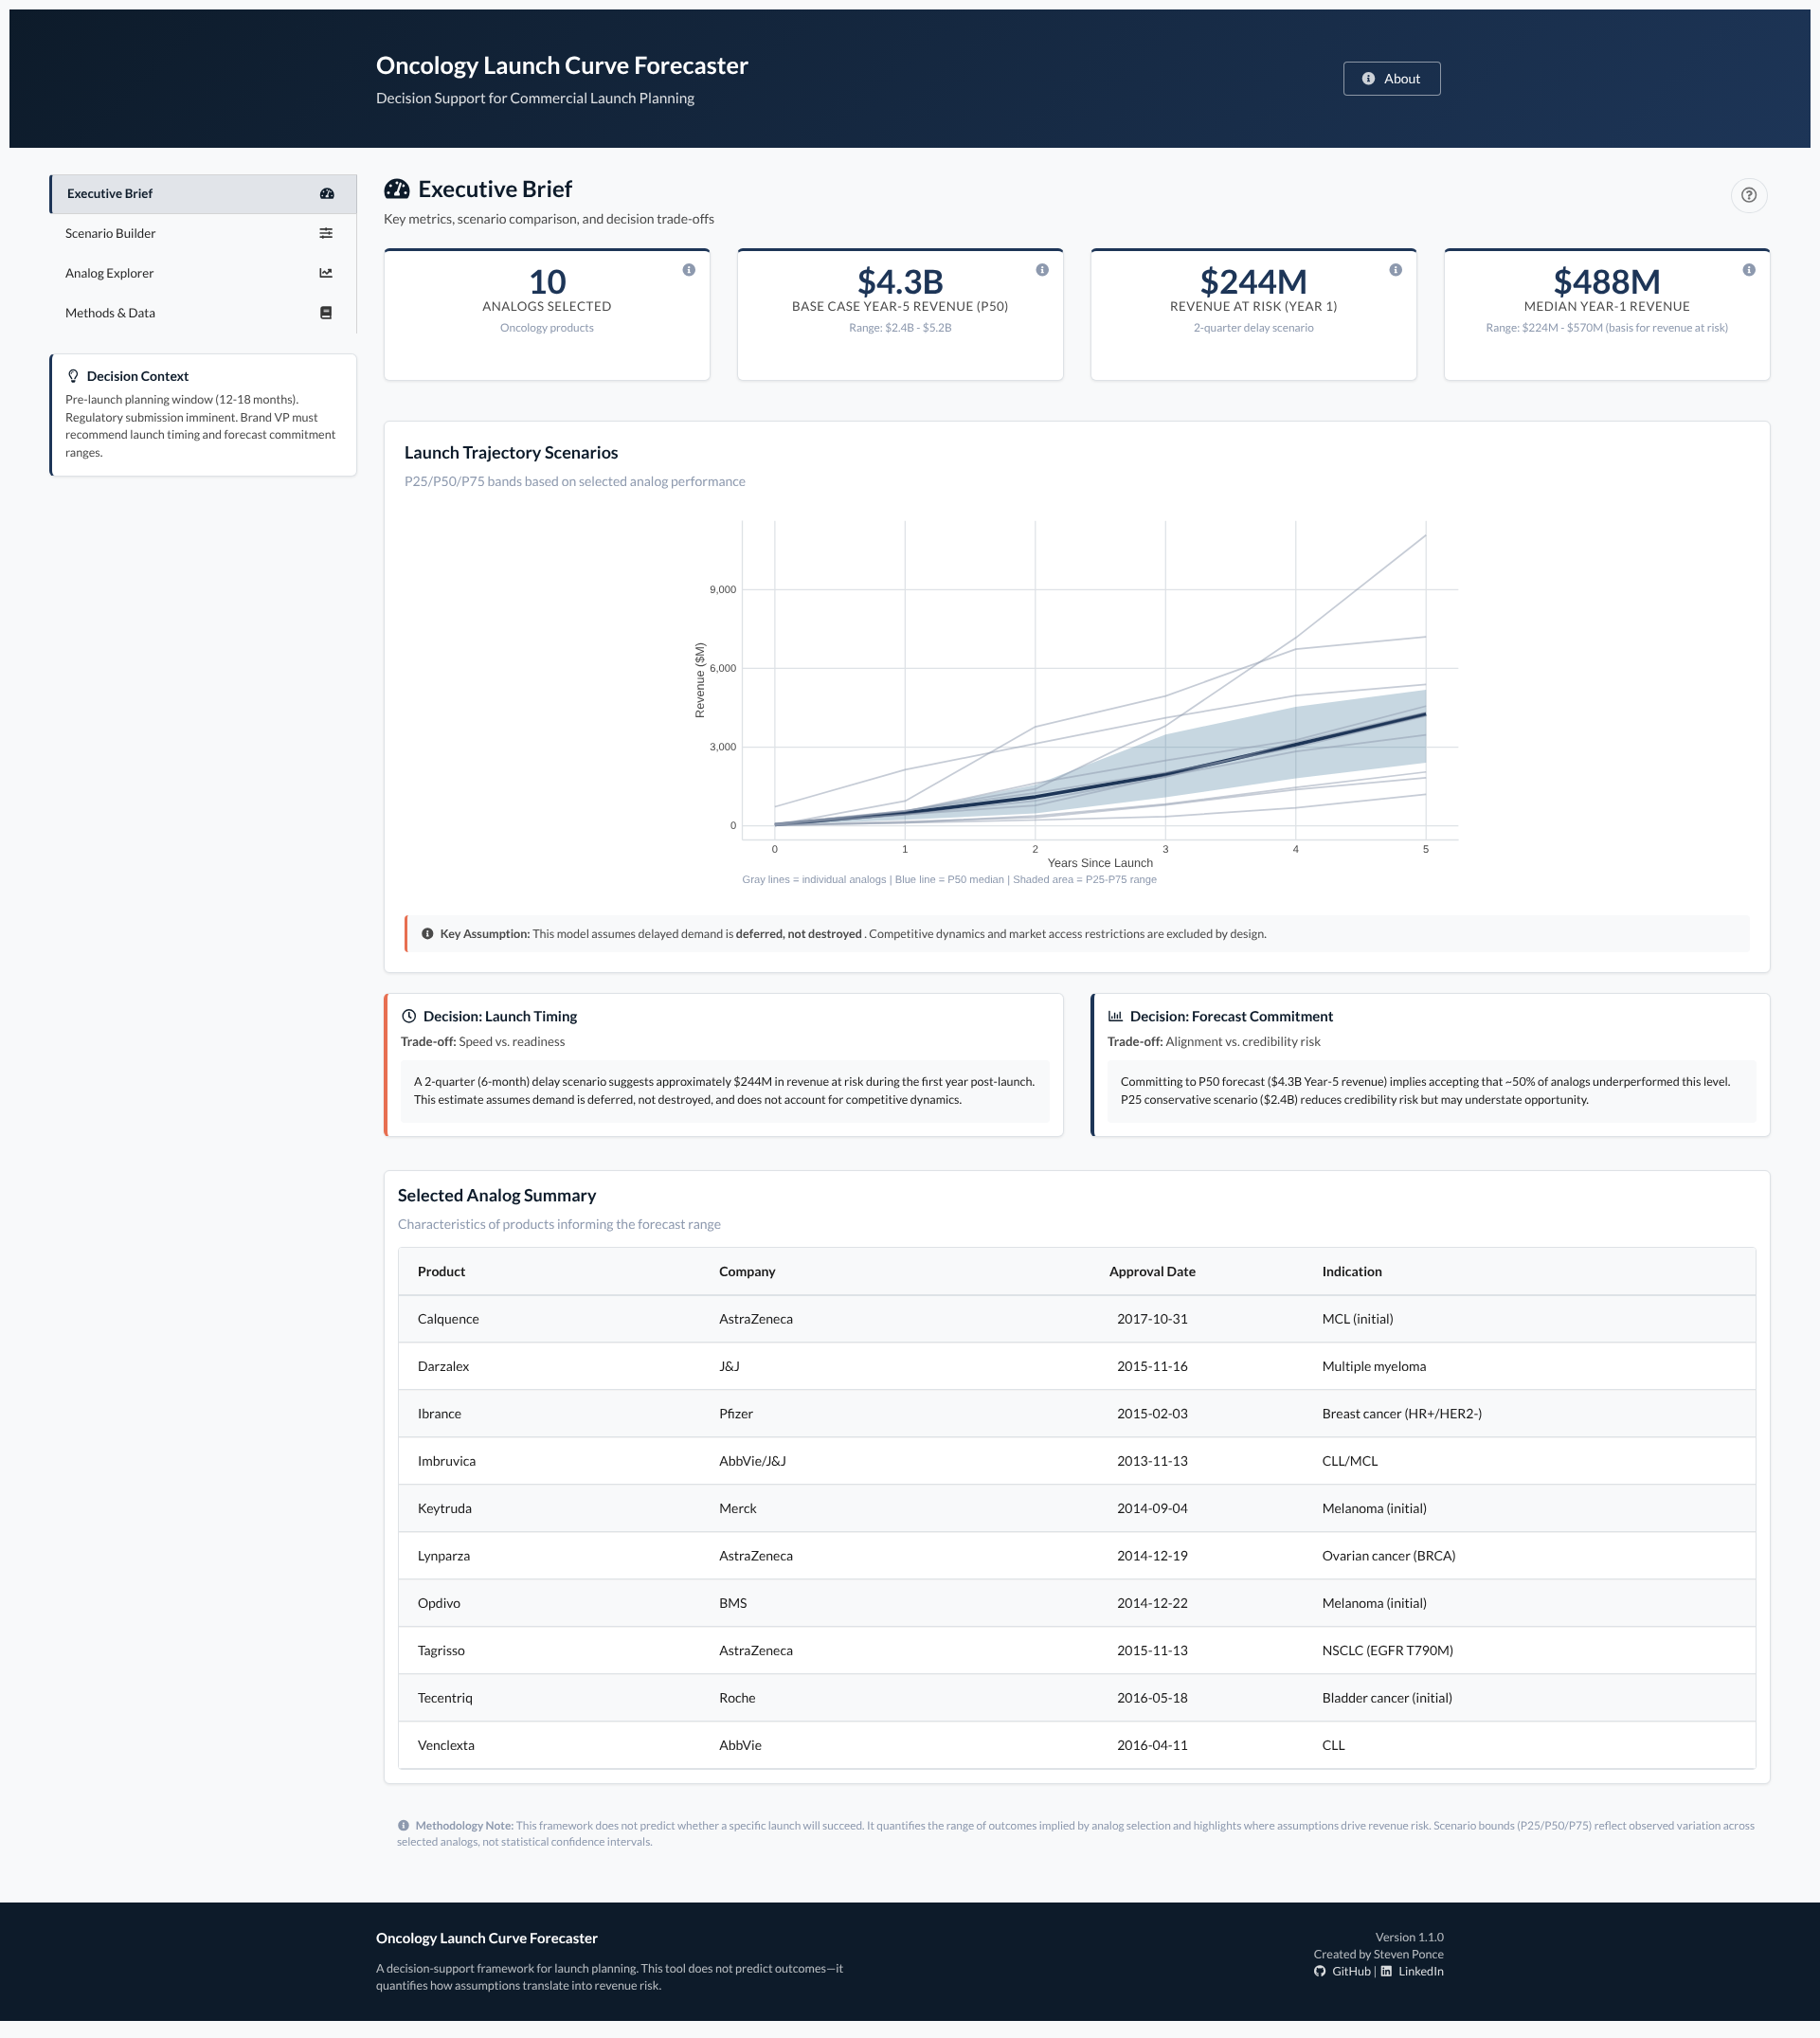
An executive-facing summary that surfaces:

  • Key metrics (analog count, historical median Year-5 revenue and range, delay exposure, median Year-1 revenue)
  • Launch trajectory scenarios with P25/P50/P75 bands
  • Two explicit decision trade-offs: launch timing and the forecast benchmark
  • Selected analog summary table

The decision boxes explicitly frame trade-offs in terms stakeholders recognize: “Speed vs. readiness” and “Alignment vs. credibility risk.”

Scenario Builder
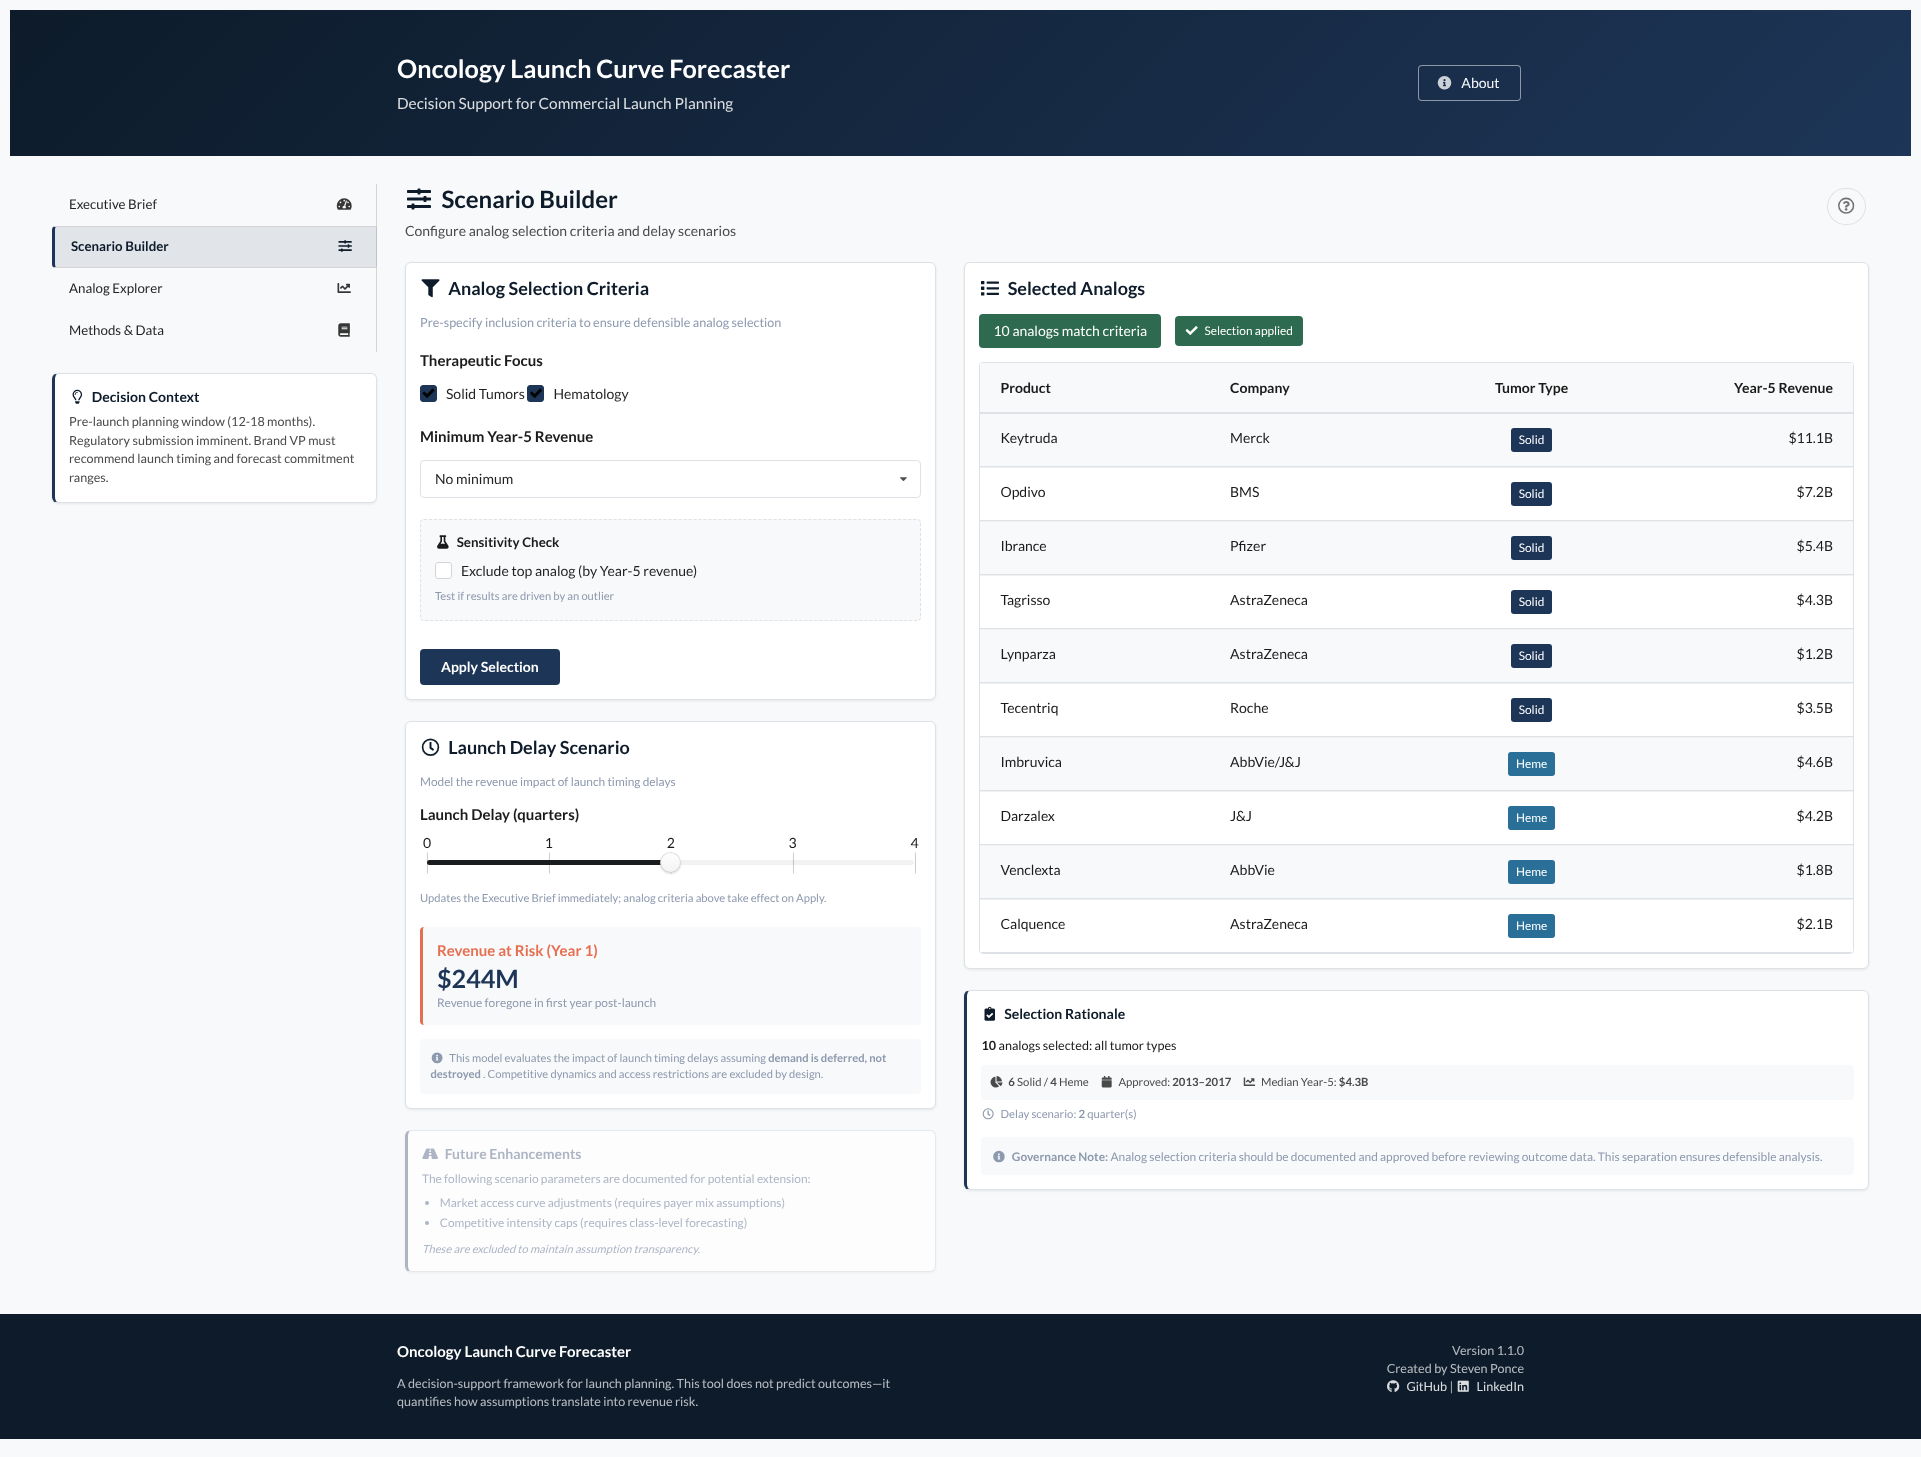
An interactive configuration view that allows users to:

  • Select therapeutic focus (solid tumors, hematology, or both)
  • Run sensitivity checks: exclude the top-performing analog, or analogs below a Year-5 revenue level
  • Configure launch delay scenarios (0–4 quarters)
  • Download a dated scenario record for the approval file

The Selection Rationale panel updates dynamically, showing live statistics and a governance note reminding users that criteria should be documented before examining outcomes.

Analog Explorer
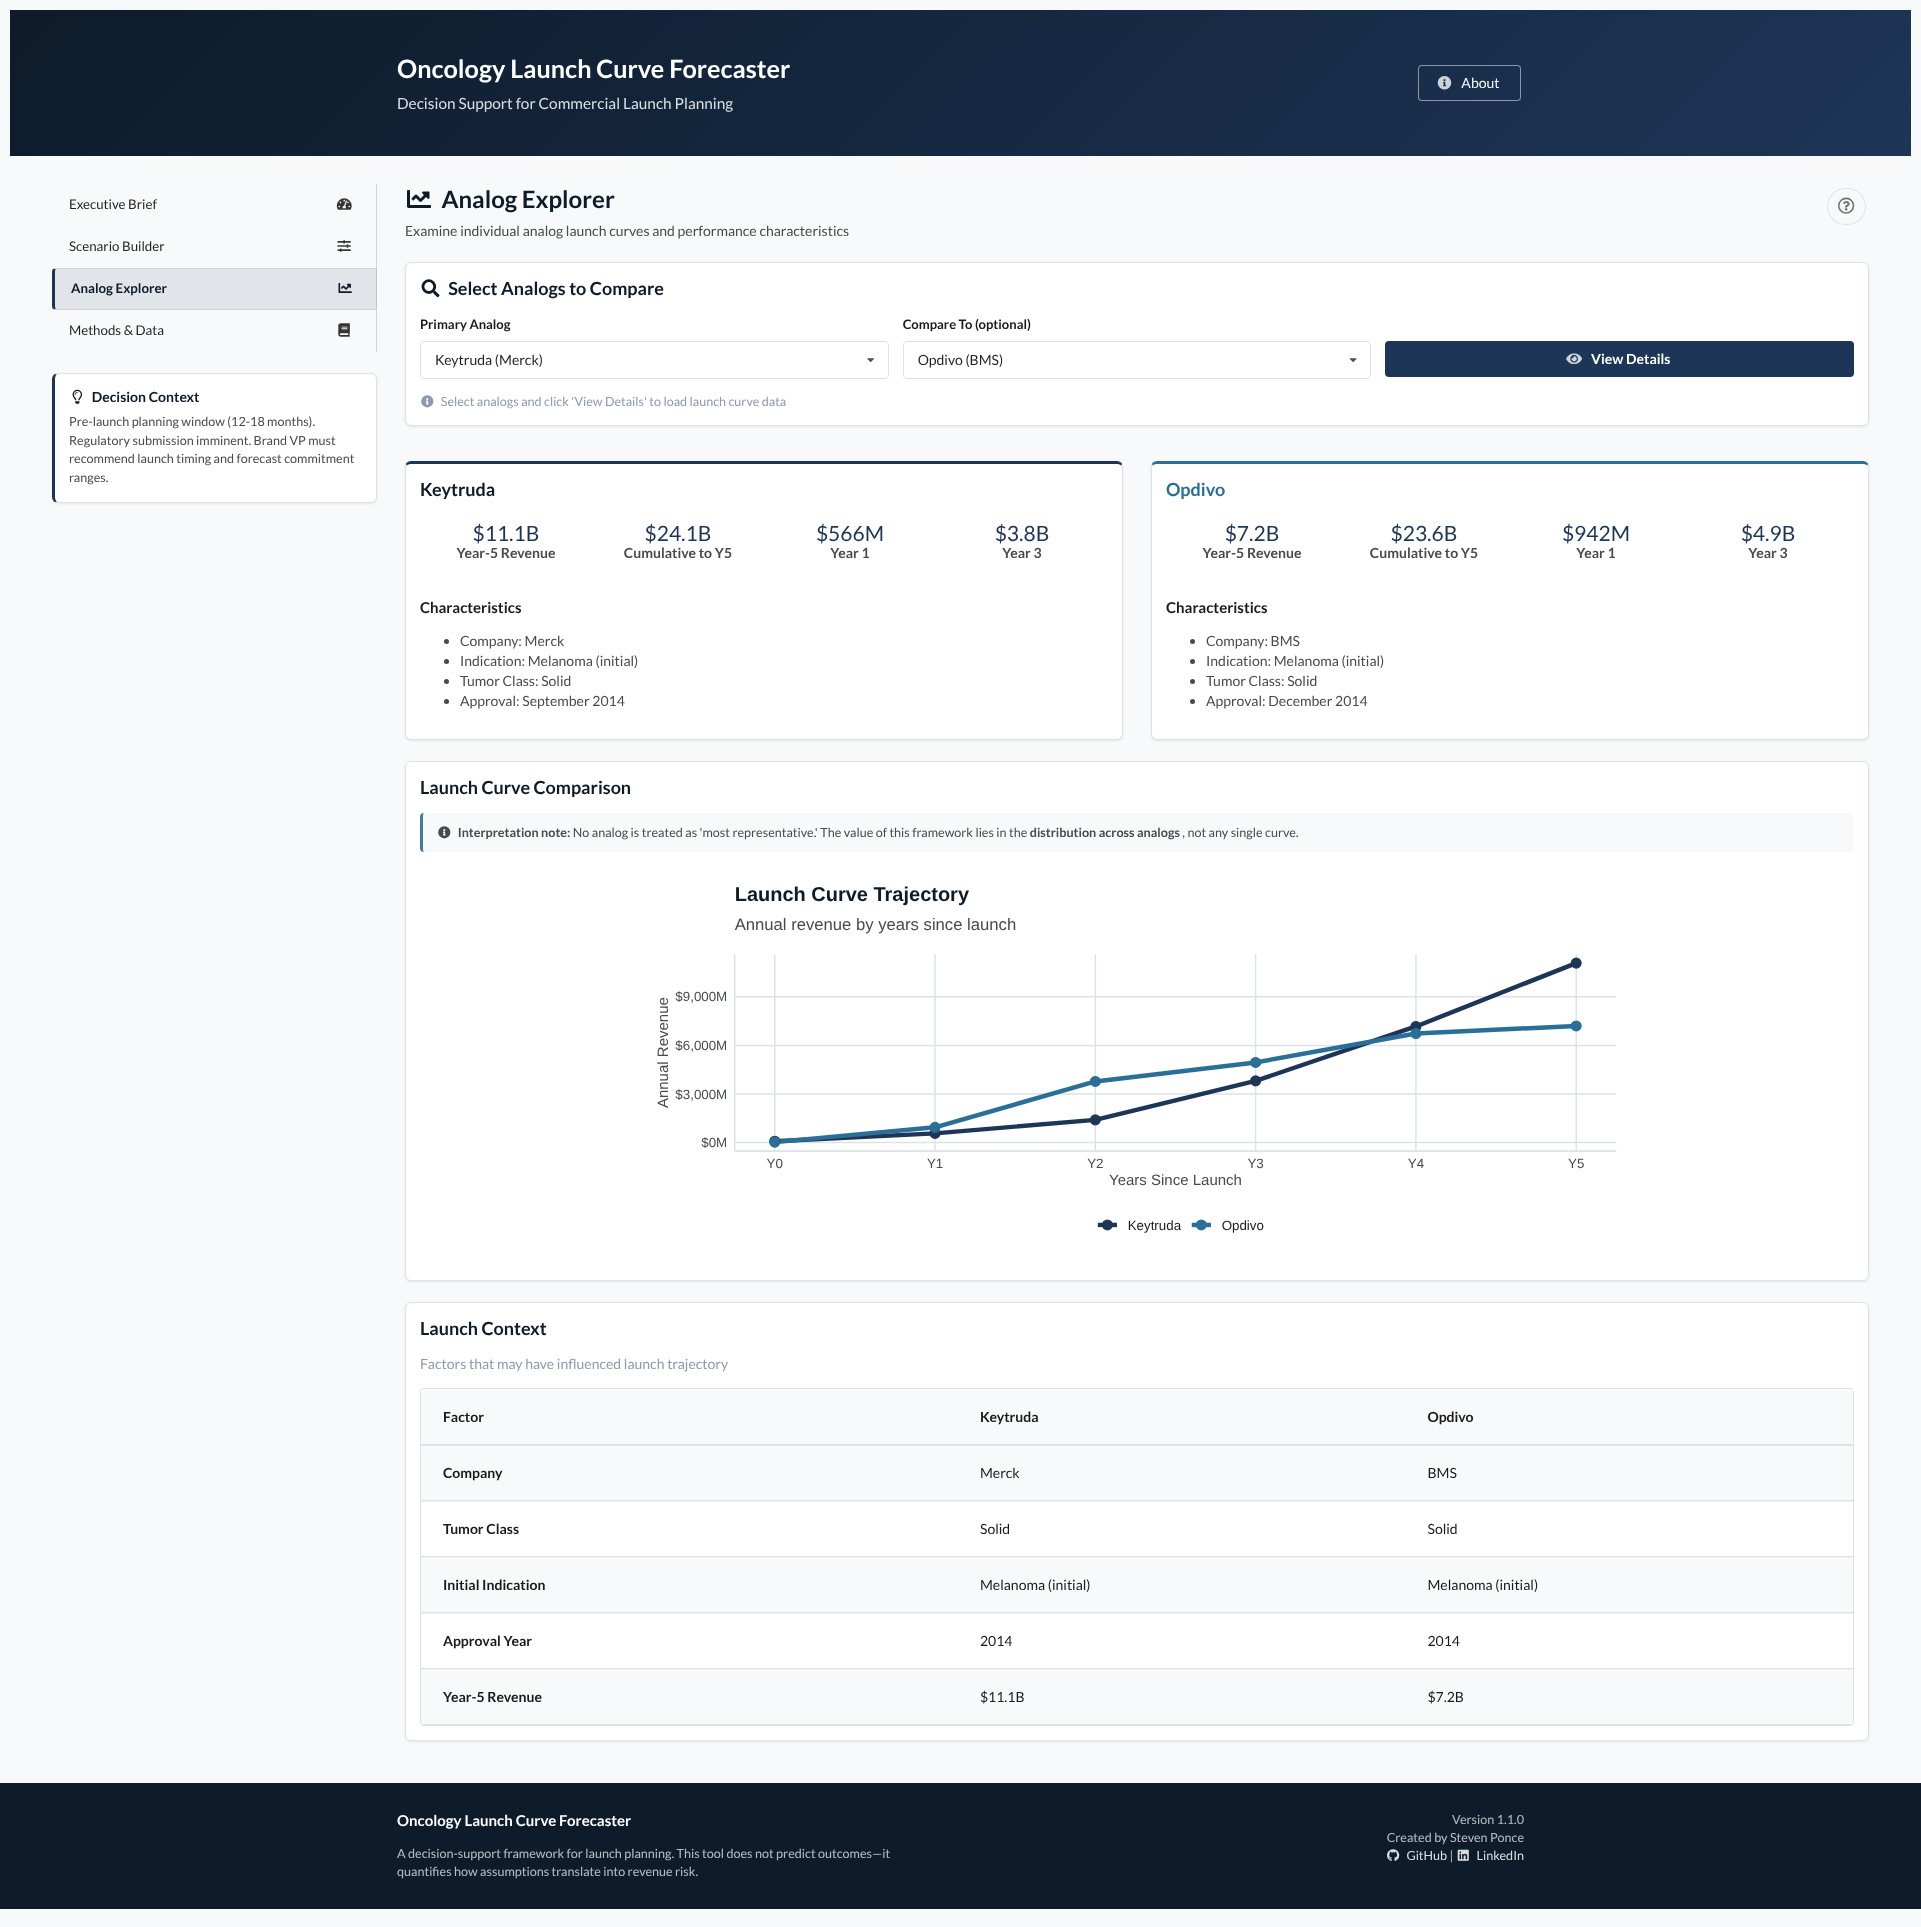
A detailed view for examining individual analog characteristics:

  • Side-by-side comparison of two selected analogs
  • Launch curve visualization showing trajectory differences
  • Characteristics table (company, indication, approval date, Year-5 revenue)
  • Launch context factors that may have influenced trajectory

This tab includes guardrails against over-interpretation: it opens on a single default analog, comparisons are an explicit choice, and an interpretation note reminds users that the framework’s value lies in the distribution across analogs, not any single curve.

Methods & Data
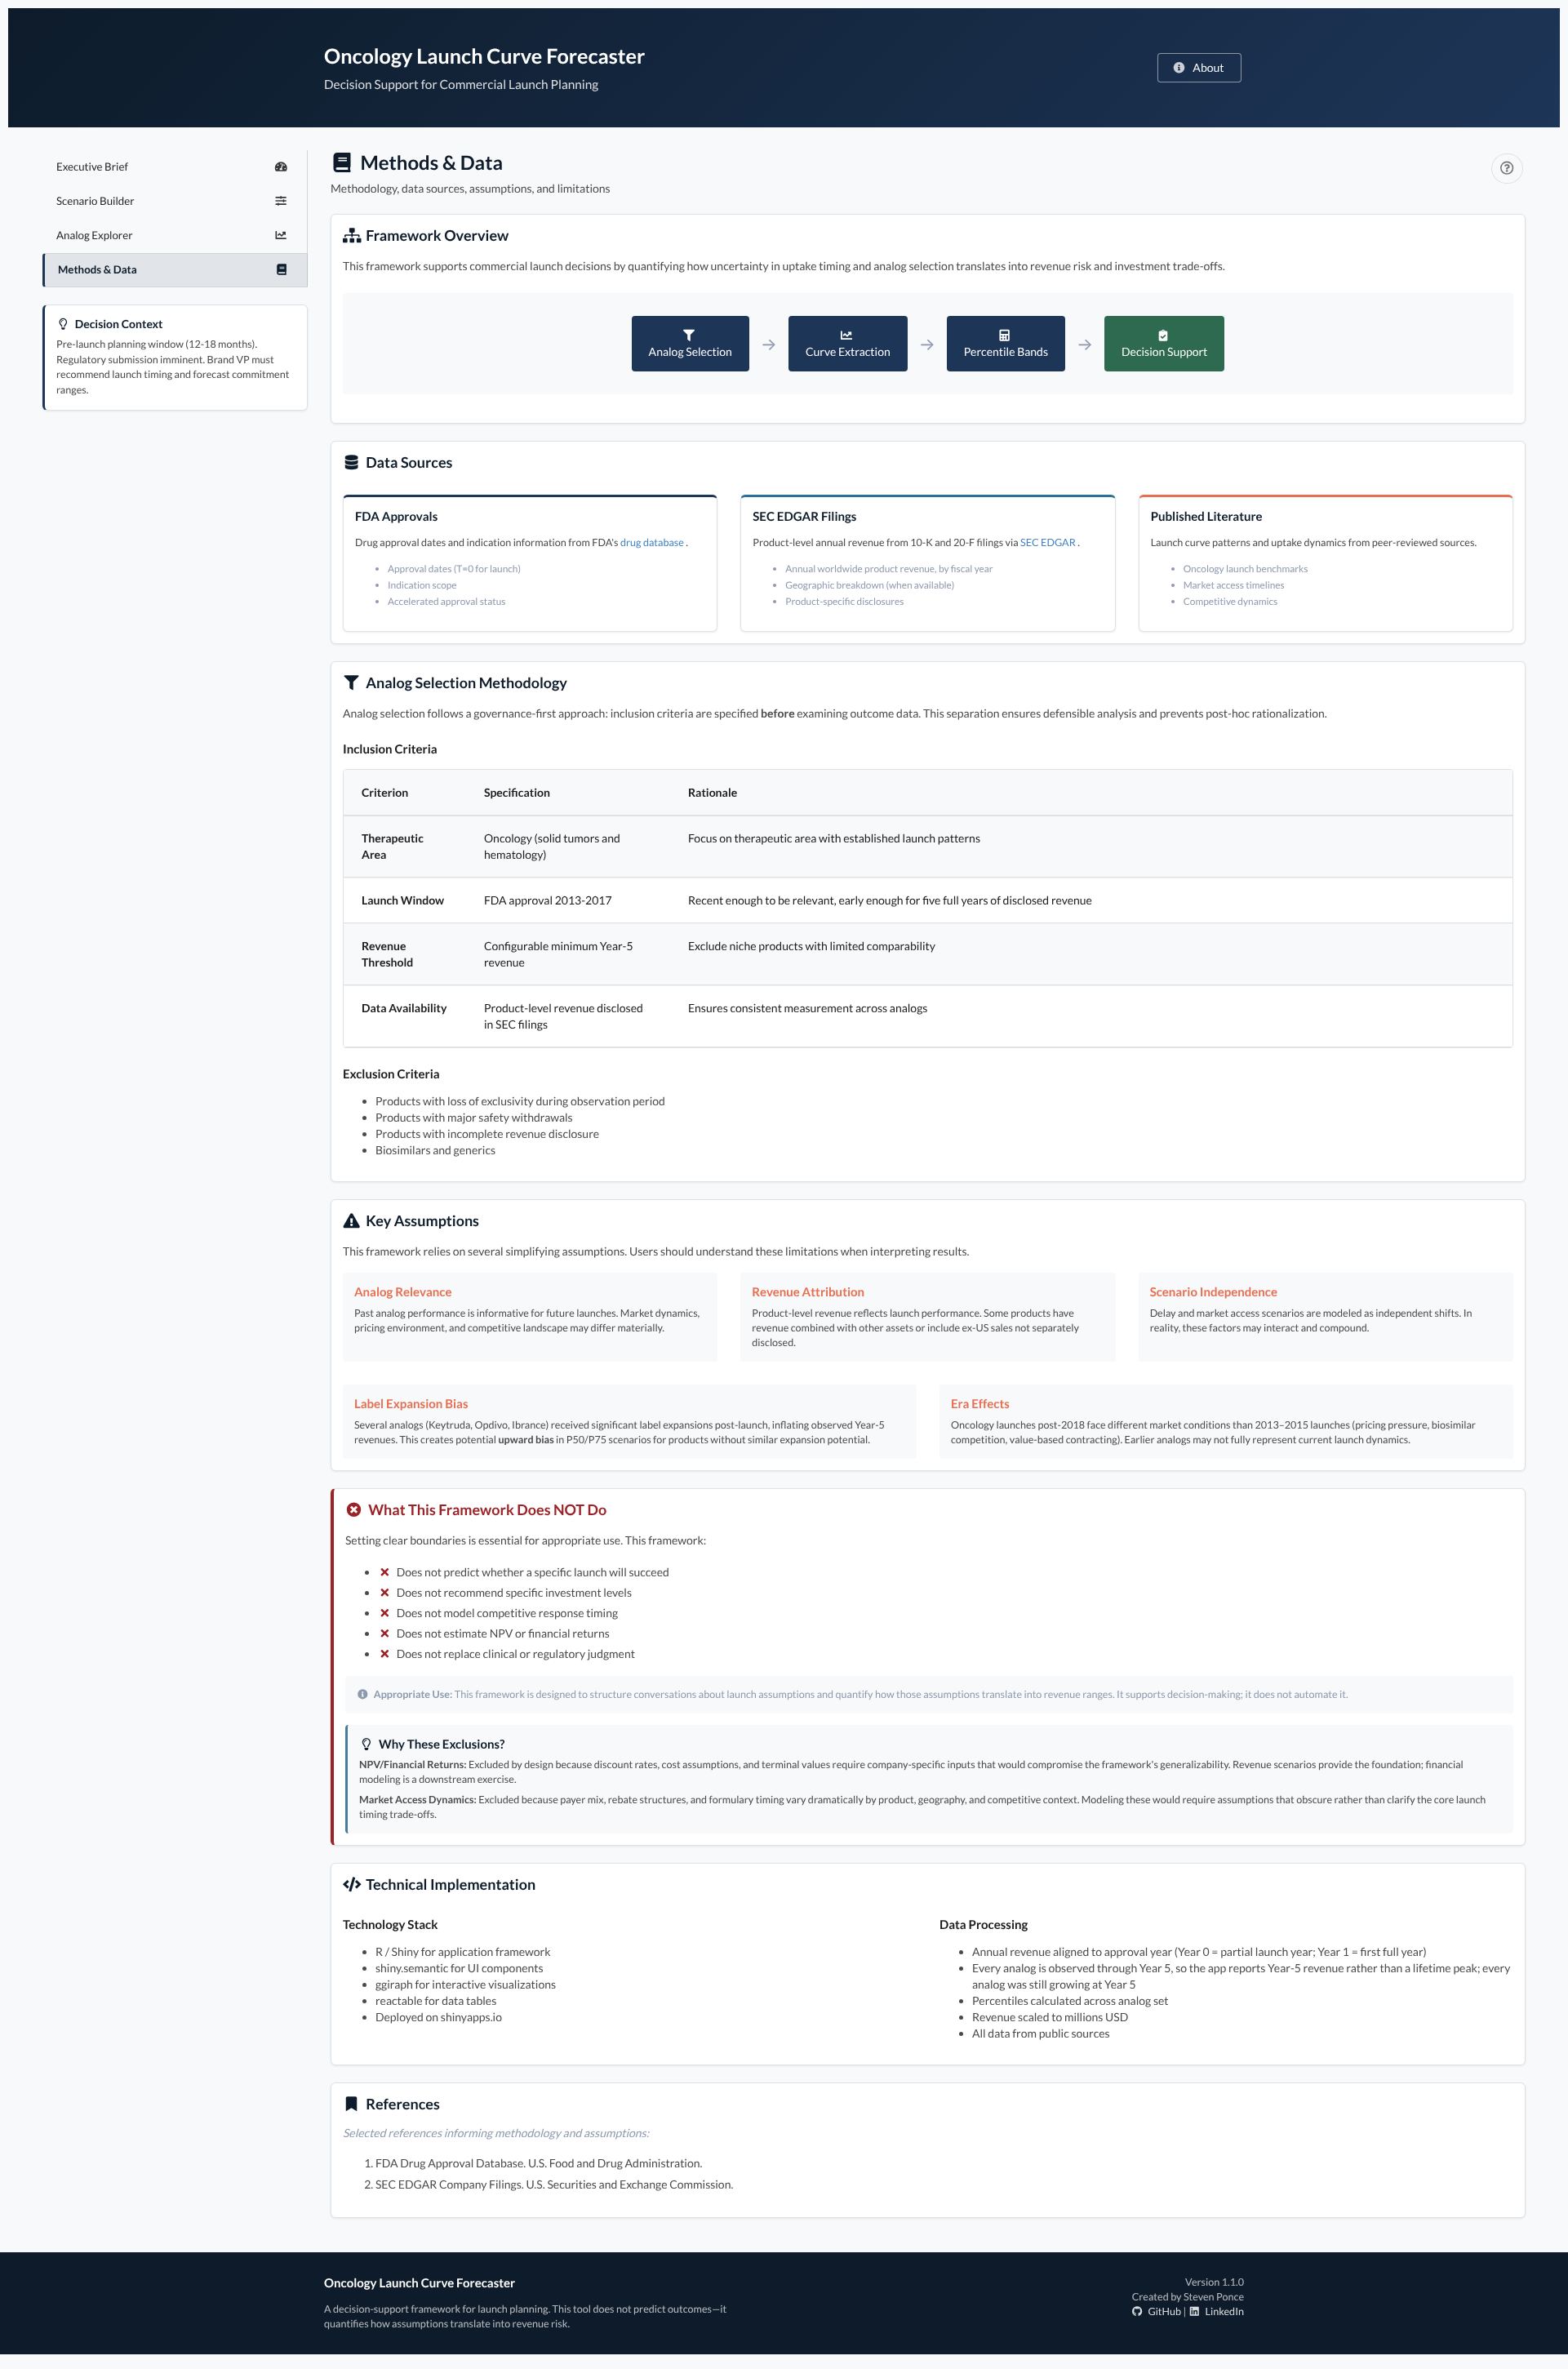
A transparency-focused section documenting:

  • Framework overview and workflow diagram
  • Data sources (FDA approvals, company-reported revenue) and the status of every value
  • Inclusion and exclusion criteria
  • Key assumptions with explicit discussion
  • “What This Framework Does NOT Do” section
  • Technical implementation details

8. The analog set

The framework includes every new oncology molecular entity first approved by the FDA in 2013–2017 whose sales one owner reported separately for five years (30 of 56 screened; CAR-T cell therapies are excluded as a different launch model):

Solid tumors (20):
Keytruda, Opdivo, Ibrance, Tagrisso, Lynparza, Tecentriq, Kadcyla, Xofigo, Cyramza, Lenvima, Unituxin, Alecensa, Lartruvo, Rubraca, Kisqali, Bavencio, Alunbrig, Imfinzi, Nerlynx, Verzenio

Hematology (10):
Imbruvica, Darzalex, Venclexta, Calquence, Pomalyst, Gazyva, Zydelig, Blincyto, Ninlaro, Empliciti

Lartruvo, withdrawn in 2019 after its confirmatory trial failed, is kept on purpose: leaving out launches that failed would bias the bands upward. The repository lists every screened drug and why it was kept or dropped.

Approval years range from 2013–2017, so every analog has a full five-year observation window while remaining recent enough to reflect modern launch dynamics. Within that window, a few reported values are missing (mostly launch years), which leaves five launch years blank across the set.


9. Technical lessons from the build

This project surfaced an important technical insight about Shiny development with CSS-based UI frameworks.

The Problem

When using shiny.semantic (which relies on Semantic UI’s CSS-based tab switching), outputs don’t render automatically when users navigate to a tab. Shiny’s lazy evaluation assumes it knows when tabs become visible—but CSS-based tabs don’t notify Shiny of visibility changes.

The Solution

Adding outputOptions(output, "output_name", suspendWhenHidden = FALSE) forces Shiny to render regardless of perceived visibility. This pattern isn’t documented in standard Shiny guides but is essential for CSS-based tab frameworks.

The catch is that it has to cover every output that depends on shared state. A later review found six small text outputs (the range line and both decision cards) without it. After a selection change, the headline number updated while the range beside it stayed stale. The complete fix pairs suspendWhenHidden = FALSE on all dependent outputs with a shown event triggered on each tab switch, and verifies the result by changing a selection and checking that every number moves together.

This discovery became the most valuable technical lesson from the project.


10. Why this framing matters for commercial analytics

This project suggests that in analog-based launch planning, the choice of comparators and assumptions can move the answer more than the method: widening the analog set alone cut the benchmark by three quarters. The failure modes it is built to guard against:

  • Analog selection was post-hoc rationalized
  • Assumptions weren’t documented or tested
  • Ranges were too narrow to capture actual uncertainty
  • Trade-offs weren’t made explicit to decision-makers

This framework addresses these failure modes directly:

  • Governance-first selection prevents cherry-picking
  • Documented assumptions create audit trails
  • P25/P50/P75 bands acknowledge inherent uncertainty
  • Explicit trade-off framing connects analysis to decisions

The goal is not better predictions, but better-structured conversations about what forecasts can and cannot support.


Appendix: Methodology & Build Notes

Data Sources

  • FDA Drug Approvals: Approval dates (T=0), initial indications
  • Company-reported revenue: Full-year worldwide product sales from annual reports and results releases (SEC 10-K and 8-K filings; AstraZeneca and Roche results announcements), with a source link for every value
  • Federal Reserve: Annual average CHF/USD rates to convert Roche’s Tecentriq sales

Technical Stack

  • Language: R (4.3+)
  • Framework: Shiny (modular architecture)
  • UI: shiny.semantic (Appsilon)
  • Visualization: ggplot2, ggiraph
  • Tables: reactable
  • Deployment: shinyapps.io

Key Design Choices

  • Launch years counted from each drug’s FDA approval date, with fiscal-year sales split across them by days
  • Percentiles calculated across analog set (not confidence intervals)
  • Revenue scaled to millions USD for readability
  • All data from public sources to ensure reproducibility

Purpose, Scope, and Disclaimer

This project is a portfolio case study intended to demonstrate analytical framing, governance, and decision-support design using publicly available data.

It is not intended for real-world commercial decision-making and is not affiliated with any pharmaceutical company. Product names are used for analytical illustration only.

All data are derived from publicly available sources including company filings and FDA databases. No proprietary or confidential information is included.

This work does not constitute investment advice, commercial guidance, or strategic recommendations.


Closing Reflection

Note

The value of this framework lies not in its predictions, but in its structure. By making analog selection defensible, assumptions transparent, and trade-offs explicit, it provides a foundation for disciplined commercial planning conversations—conversations that connect forecast ranges to revenue-at-risk and timing decisions to resource commitments.

In launch planning, clarity about what we don’t know is often more valuable than false confidence about what we do.

Updated October 2026: revenue figures relabeled as Year-5 revenue rather than peak; all 60 revenue values re-sourced from company filings (35 changed; see the correction note at the top); corrected the data-source, era-effects, launch-year alignment and outcome-filter descriptions; replaced the deferred-only delay estimate with a cost of delay that assumes a fixed exclusivity end date; added a product mode that scales analog launch shapes to an expected Year-5 revenue; expanded the technical lesson on tab rendering; expanded the analog set from 10 to 30 (every eligible 2013–2017 oncology launch) and aligned launch years to exact approval dates. After an external review: relabeled the delay cost as an exposure estimate rather than a lower bound, described percentiles as historical reference points, added a downloadable scenario record (criteria are saved when a selection is applied, so the record always matches its results), and stated that the direction of the remaining selection bias is unknown.

Back to top

Citation

BibTeX citation:
@online{ponce2026,
  author = {Ponce, Steven},
  title = {Governance-First {Launch} {Forecasting:} {A} {Decision}
    {Support} {Framework}},
  date = {2026-01-28},
  url = {https://stevenponce.netlify.app/projects/standalone_visualizations/sa_2026-01-28.html},
  langid = {en}
}
For attribution, please cite this work as:
Ponce, Steven. 2026. “Governance-First Launch Forecasting: A Decision Support Framework.” January 28. https://stevenponce.netlify.app/projects/standalone_visualizations/sa_2026-01-28.html.
Source Code
---
title: "Governance-First Launch Forecasting: A Decision Support Framework"
subtitle: "Quantifying revenue risk from launch timing uncertainty using analog-based scenario analysis"
description: "A case study in building decision support for pharmaceutical commercial planning—using governance-first analog selection, transparent assumptions, and explicit trade-off framing to quantify revenue at risk under launch timing uncertainty."
date: "2026-01-28"
author:
  - name: "Steven Ponce"
    url: "https://stevenponce.netlify.app"
    orcid: "0000-0003-4457-1633"
citation:    
    url: "https://stevenponce.netlify.app/projects/standalone_visualizations/sa_2026-01-28.html"
categories: ["Shiny", "Pharma & Healthcare", "2026"]
tags: ["r-shiny", "pharmaceutical", "commercial-analytics", "forecasting", "oncology", "decision-support", "governance"]
image: "thumbnails/sa_2026-01-28.png"
format:
  html:
    toc: true
    toc-depth: 4
    code-link: true
    code-fold: true
    code-tools: true
    code-summary: "Show code"
editor_options:  
  chunk_output_type: inline
execute:
  freeze: true
  cache: true
  error: false
  message: false
  warning: false
  eval: true
editor: 
  markdown: 
    wrap: 72
---

```{r setup}
#| label: setup
#| include: false
knitr::opts_chunk$set(dev = "png", fig.width = 9, fig.height = 10, dpi = 320)
```

🚀 **Live app:**\
[Oncology Launch Curve
Forecaster](https://0l6jpd-steven-ponce.shinyapps.io/launch_curve_forecaster/)

💻 **Source code:**\
[GitHub repository](https://github.com/poncest/launch-curve-forecaster)

::: callout-warning
## Data correction (October 2026, original ten analogs)

All 60 revenue values behind the original ten analog curves were re-checked against
the companies' own reports: 35 changed, and 55 are now verified against
a primary source. The original dataset had Tecentriq in Swiss francs labeled as
US dollars, an Imbruvica series that mixed two definitions, and several
values that did not match the filings (Calquence 2019, for example, was
$164M reported vs $372M stored). Each value now carries its source and
verification status in the repository, and the dashboard figures are
recomputed from the corrected data.
:::

::: callout-note
## Analog set expanded (October 2026)

The original ten analogs were all prominent launches, so the bands
overstated a typical launch. Every new oncology molecular entity first
approved by the FDA in 2013–2017 was then screened (56 products), and the
set grew to **30 analogs**, including modest launches and one withdrawn
drug. The median (P50) Year-5 revenue fell from about $4.3B to **$981M**.
The figures below use the 30-analog set.
:::

------------------------------------------------------------------------

> *The core challenge in launch planning isn't predicting success—it's
> quantifying how much uncertainty costs when timing shifts.*

------------------------------------------------------------------------

## [1. Framing the problem]{.smallcaps}

Pre-launch planning in pharmaceutical commercialization involves
decisions under substantial uncertainty. Brand teams must commit to
launch timing, resource allocation, and forecast ranges while facing
unknowns about regulatory approval timing, manufacturing readiness, and
market reception.

The natural instinct is to seek precision: better models, more data,
tighter confidence intervals. But in practice, the harder problem is
often **structuring the conversation** around forecast ranges,
revenue-at-risk, and timing shifts—rather than eliminating uncertainty
entirely.

This project approaches launch forecasting as a **governance and framing
problem**, rather than a prediction exercise. The objective is not to
forecast whether a specific launch will succeed, but to quantify **how
analog selection and timing assumptions translate into revenue
risk**—making trade-offs explicit for cross-functional discussion.

In practice, this means shifting the question from "What will happen?"
to "What are we implicitly assuming—and what does that assumption cost
if it's wrong?"

------------------------------------------------------------------------

## [2. The core decision question]{.smallcaps}

The framework is designed around a single, actionable question:

**What is the revenue at risk if launch timing shifts under
uncertainty?**

This question matters because it connects analytical work directly to
decisions that leadership teams actually face:

-   How much revenue exposure exists in Year 1 if launch slips by one or
    two quarters?
-   What forecast commitment range (P25/P50/P75) is defensible given
    analog variation?
-   How sensitive are these conclusions to which analogs are included?

In practice, timing assumptions also propagate into manufacturing
readiness, commercial resourcing, and financial guidance—making early
uncertainty costly to unwind later.

Rather than producing point forecasts, the framework surfaces **ranges
and trade-offs** that support structured executive discussion.

------------------------------------------------------------------------

## [3. Why governance-first analog selection]{.smallcaps}

Analog-based forecasting is common in pharmaceutical commercial
planning. The challenge is that analog selection is inherently
subjective—and post-hoc adjustments can undermine credibility.

This framework applies a **governance-first methodology**:

1.  **Define inclusion criteria before examining outcomes** —
    Therapeutic area, launch window, and data availability
    requirements are specified upfront. Filters that look at outcomes
    (a minimum Year-5 revenue, excluding the top analog) are offered
    only as sensitivity checks.
2.  **Record the analog list** — The app does not enforce this, since
    anyone can change a selection and see the results. Instead, the
    Scenario Builder exports a dated **scenario record**: criteria,
    included and excluded products with the reason for each exclusion,
    whether an outcome-based filter was on, the data version, inputs,
    results and a free-text rationale. That record is what gets filed
    with the approval, which happens outside the app.
3.  **Document rationale for every inclusion/exclusion** — Every one
    of the 56 screened drugs has a recorded keep/drop reason, which
    creates an audit trail for reviewers.
4.  **Test sensitivity explicitly** — Option to exclude the
    top-performing analog tests whether conclusions depend on outliers.

This approach addresses a common critique of analog analysis: that
analysts cherry-pick comparators to support predetermined conclusions.
By separating selection criteria from outcome examination, the framework
survives skeptical review.

This governance-first approach is operationalized in the app through
four components: **Executive Brief** (scenario comparison and trade-off
framing), **Scenario Builder** (criteria configuration and sensitivity
testing), **Analog Explorer** (individual product examination with
guardrails), and **Methods & Data** (assumption documentation and scope
boundaries).

------------------------------------------------------------------------

## [4. What the framework quantifies]{.smallcaps}

### Delay Exposure

A delay usually does not move the patent or exclusivity end date. The
months lost at launch are therefore lost at the *end* of exclusivity,
not simply shifted later. The framework shows that exposure next to the
smaller amount of first-year sales that is only deferred:

```         
Delay exposure (fixed exclusivity end) = delay_quarters / 4 × median Year-5 revenue
Deferred first-year sales              = delay_quarters × (median Year-1 revenue / 4)
```

For a two-quarter delay across all 30 analogs, the exposure is about
$490M, against about $87M of first-year sales deferred. The exposure
figure assumes the Year-5 run rate applies to the final quarters of
exclusivity, often ten or more years after launch. Sales then could be
higher (continued growth) or lower (competition, label changes), so it
is an exposure estimate, not a bound. A full comparison would value the
delayed and on-time revenue paths over the same calendar horizon. Share
lost to earlier competitors is not modeled.

### Product Mode: Analogs as Shapes

Even a complete analog set's dollar figures say little about a specific product.
In practice, analogs supply the *shape* of a launch, and the size comes
from the product's own forecast. The Scenario Builder therefore takes
an optional expected Year-5 revenue. Each analog's curve is divided by
its own Year-5 revenue, and the shapes are scaled to that figure. For an
expected $1B at Year 5, the median shape implies about $129M in Year 1
(P25–P75: $91M–$232M), and a two-quarter delay exposes about $500M at
the end of exclusivity. Lartruvo, withdrawn before Year 5, has no
defined shape and is left out of this mode.

This is explicitly labeled as a **Year 1 average-quarter
approximation**—a simplification that provides directional magnitude
without implying DCF-level precision.

### Scenario Bands from Analog Variation

Percentile bands (P25/P50/P75) are derived from observed analog
performance:

-   **P50:** historical median of the selected analogs
-   **P25 / P75:** historical interquartile range

These represent **observed variation across analogs**, not statistical
confidence intervals, and P50 is not a 50% probability for a new
product. The distinction matters: they quantify historical
heterogeneity, not forecasting uncertainty. The median curve also joins
each year's median, which can come from different products, so it
summarizes the set rather than tracing a launch that happened; the
chart shows how many analogs sit behind each year (26 to 30).

Revenue figures describe **Year-5 revenue**, not a lifetime peak. Every
analog is observed for five years after approval, and most were still
growing at Year 5. Labeling that value "peak" would understate products
like Keytruda, whose revenue kept climbing well beyond the observation
window.

### Selection Statistics

Dynamic statistics update as criteria change:

-   Solid tumor vs. hematology count
-   Approval year range
-   Median Year-5 revenue
-   Number of analogs meeting criteria

This transparency helps users understand what's driving the scenario
range.

------------------------------------------------------------------------

## [5. Key assumptions documented]{.smallcaps}

The framework relies on several simplifying assumptions that users
should understand:

**Demand deferral, not destruction**\
Delayed demand is assumed to shift forward in time rather than being
permanently lost. Competitive dynamics and access erosion are not
modeled.

**Label expansion bias**\
Some analogs experienced significant post-launch indication expansions,
creating potential upward bias in Year-5 revenue estimates. Products
without similar expansion potential may underperform these benchmarks.

**Era effects**\
The analog set covers FDA approvals from 2013 to 2017 only. Launches
after 2018 face different conditions (pricing pressure, value-based
contracting, more crowded classes), which this set does not represent.

**Data availability**\
Sixteen eligible drugs were dropped because their owner did not report
their sales separately for every year, or because ownership changed in
the first five years. They include small launches (Farydak, Odomzo)
and large ones (Tafinlar + Mekinist, Zejula), so the direction and size
of any remaining bias are unknown. Five launch years are also missing (for
example Kadcyla's first two), so early-year percentiles rest on 26–29
analogs.

**Worldwide revenue and launch-year alignment**\
Values are company-reported worldwide product sales, converted to US
dollars at Federal Reserve average rates; geographic mix differences are
not adjusted. Launch Year 1 is the 12 months after each drug's FDA
approval date. Companies report by fiscal year, so each annual total is
spread evenly over its days and split across the launch years it
overlaps. Sales usually grow within a year, so early launch years are
slightly overstated. Worldwide sales are aligned to the US approval
date, so a drug sold elsewhere first (Alecensa in Japan from 2014) has
higher early launch years, and one launched outside the US later has
lower ones.

These assumptions are documented in the Methods & Data tab and surfaced
in the dashboard interface to prevent over-interpretation.

------------------------------------------------------------------------

## [6. What this framework does—and does not—do]{.smallcaps}

### What it does

✅ Structures analog-based launch scenario analysis\
✅ Quantifies revenue ranges from analog variation (P25/P50/P75)\
✅ Supports structured trade-off conversations under uncertainty\
✅ Documents assumptions and limitations transparently\
✅ Provides sensitivity checks to test analytical robustness

### What it does not do

❌ Predict whether a specific launch will succeed\
❌ Recommend specific investment or resourcing levels\
❌ Model competitive response or market access dynamics\
❌ Estimate NPV or financial returns\
❌ Replace clinical, regulatory, or strategic judgment

**By design:** NPV and market access modeling are excluded because they
require company-specific inputs that would compromise generalizability.
Revenue scenarios are treated as **foundational inputs** to financial
modeling, not final outputs.

------------------------------------------------------------------------

## [7. Dashboard structure]{.smallcaps}

The application is organized into four complementary views:

### Executive Brief

![](https://raw.githubusercontent.com/poncest/launch-curve-forecaster/main/screenshots/executive_brief.png)

An executive-facing summary that surfaces:

-   Key metrics (analog count, historical median Year-5 revenue and
    range, delay exposure, median Year-1 revenue)
-   Launch trajectory scenarios with P25/P50/P75 bands
-   Two explicit decision trade-offs: launch timing and the forecast
    benchmark
-   Selected analog summary table

The decision boxes explicitly frame trade-offs in terms stakeholders
recognize: "Speed vs. readiness" and "Alignment vs. credibility risk."

### Scenario Builder

![](https://raw.githubusercontent.com/poncest/launch-curve-forecaster/main/screenshots/scenario_builder.png)

An interactive configuration view that allows users to:

-   Select therapeutic focus (solid tumors, hematology, or both)
-   Run sensitivity checks: exclude the top-performing analog, or
    analogs below a Year-5 revenue level
-   Configure launch delay scenarios (0–4 quarters)
-   Download a dated scenario record for the approval file

The Selection Rationale panel updates dynamically, showing live
statistics and a governance note reminding users that criteria should be
documented before examining outcomes.

### Analog Explorer

![](https://raw.githubusercontent.com/poncest/launch-curve-forecaster/main/screenshots/analog_explorer.png)

A detailed view for examining individual analog characteristics:

-   Side-by-side comparison of two selected analogs
-   Launch curve visualization showing trajectory differences
-   Characteristics table (company, indication, approval date, Year-5
    revenue)
-   Launch context factors that may have influenced trajectory

This tab includes guardrails against over-interpretation: it opens on
a single default analog, comparisons are an explicit choice, and an
interpretation note reminds users that the framework's value lies in the
distribution across analogs, not any single curve.

### Methods & Data

![](https://raw.githubusercontent.com/poncest/launch-curve-forecaster/main/screenshots/methods.png)

A transparency-focused section documenting:

-   Framework overview and workflow diagram
-   Data sources (FDA approvals, company-reported revenue) and the
    status of every value
-   Inclusion and exclusion criteria
-   Key assumptions with explicit discussion
-   "What This Framework Does NOT Do" section
-   Technical implementation details

------------------------------------------------------------------------

## [8. The analog set]{.smallcaps}

The framework includes every new oncology molecular entity first
approved by the FDA in 2013–2017 whose sales one owner reported
separately for five years (30 of 56 screened; CAR-T cell therapies are
excluded as a different launch model):

**Solid tumors (20):**\
Keytruda, Opdivo, Ibrance, Tagrisso, Lynparza, Tecentriq, Kadcyla,
Xofigo, Cyramza, Lenvima, Unituxin, Alecensa, Lartruvo, Rubraca,
Kisqali, Bavencio, Alunbrig, Imfinzi, Nerlynx, Verzenio

**Hematology (10):**\
Imbruvica, Darzalex, Venclexta, Calquence, Pomalyst, Gazyva, Zydelig,
Blincyto, Ninlaro, Empliciti

Lartruvo, withdrawn in 2019 after its confirmatory trial failed, is kept
on purpose: leaving out launches that failed would bias the bands
upward. The repository lists every screened drug and why it was kept or
dropped.

Approval years range from 2013–2017, so every analog has a full
five-year observation window while remaining recent enough to reflect
modern launch dynamics. Within that window, a few reported values are
missing (mostly launch years), which leaves five launch years blank
across the set.

------------------------------------------------------------------------

## [9. Technical lessons from the build]{.smallcaps}

This project surfaced an important technical insight about Shiny
development with CSS-based UI frameworks.

### The Problem

When using shiny.semantic (which relies on Semantic UI's CSS-based tab
switching), outputs don't render automatically when users navigate to a
tab. Shiny's lazy evaluation assumes it knows when tabs become
visible—but CSS-based tabs don't notify Shiny of visibility changes.

### The Solution

Adding `outputOptions(output, "output_name", suspendWhenHidden = FALSE)`
forces Shiny to render regardless of perceived visibility. This pattern
isn't documented in standard Shiny guides but is essential for CSS-based
tab frameworks.

The catch is that it has to cover **every** output that depends on
shared state. A later review found six small text outputs (the range
line and both decision cards) without it. After a selection change, the
headline number updated while the range beside it stayed stale. The
complete fix pairs `suspendWhenHidden = FALSE` on all dependent outputs
with a `shown` event triggered on each tab switch, and verifies the
result by changing a selection and checking that every number moves
together.

This discovery became the most valuable technical lesson from the
project.

------------------------------------------------------------------------

## [10. Why this framing matters for commercial analytics]{.smallcaps}

This project suggests that in analog-based launch planning, the choice
of comparators and assumptions can move the answer more than the
method: widening the analog set alone cut the benchmark by three
quarters. The failure modes it is built to guard against:

-   Analog selection was post-hoc rationalized
-   Assumptions weren't documented or tested
-   Ranges were too narrow to capture actual uncertainty
-   Trade-offs weren't made explicit to decision-makers

This framework addresses these failure modes directly:

-   **Governance-first selection** prevents cherry-picking
-   **Documented assumptions** create audit trails
-   **P25/P50/P75 bands** acknowledge inherent uncertainty
-   **Explicit trade-off framing** connects analysis to decisions

The goal is not better predictions, but **better-structured
conversations** about what forecasts can and cannot support.

------------------------------------------------------------------------

## [Appendix: Methodology & Build Notes]{.smallcaps}

### Data Sources

-   **FDA Drug Approvals:** Approval dates (T=0), initial indications
-   **Company-reported revenue:** Full-year worldwide product sales from
    annual reports and results releases (SEC 10-K and 8-K filings;
    AstraZeneca and Roche results announcements), with a source link
    for every value
-   **Federal Reserve:** Annual average CHF/USD rates to convert Roche's
    Tecentriq sales

### Technical Stack

-   **Language:** R (4.3+)
-   **Framework:** Shiny (modular architecture)
-   **UI:** shiny.semantic (Appsilon)
-   **Visualization:** ggplot2, ggiraph
-   **Tables:** reactable
-   **Deployment:** shinyapps.io

### Key Design Choices

-   Launch years counted from each drug's FDA approval date, with
    fiscal-year sales split across them by days
-   Percentiles calculated across analog set (not confidence intervals)
-   Revenue scaled to millions USD for readability
-   All data from public sources to ensure reproducibility

------------------------------------------------------------------------

## Purpose, Scope, and Disclaimer

This project is a **portfolio case study** intended to demonstrate
analytical framing, governance, and decision-support design using
publicly available data.

It is **not intended for real-world commercial decision-making** and is
not affiliated with any pharmaceutical company. Product names are used
for analytical illustration only.

All data are derived from publicly available sources including company
filings and FDA databases. No proprietary or confidential information is
included.

This work does not constitute investment advice, commercial guidance, or
strategic recommendations.

------------------------------------------------------------------------

## Closing Reflection

::: callout-note
The value of this framework lies not in its predictions, but in its
structure. By making analog selection defensible, assumptions
transparent, and trade-offs explicit, it provides a foundation for
**disciplined commercial planning conversations**—conversations that
connect forecast ranges to revenue-at-risk and timing decisions to
resource commitments.

In launch planning, clarity about what we don't know is often more
valuable than false confidence about what we do.
:::

*Updated October 2026: revenue figures relabeled as Year-5 revenue
rather than peak; all 60 revenue values re-sourced from company filings
(35 changed; see the correction note at the top); corrected the
data-source, era-effects, launch-year alignment and outcome-filter
descriptions; replaced the deferred-only delay estimate with a cost of
delay that assumes a fixed exclusivity end date; added a product mode
that scales analog launch shapes to an expected Year-5 revenue; expanded the technical
lesson on tab rendering; expanded the analog set from 10 to 30 (every
eligible 2013–2017 oncology launch) and aligned launch years to exact
approval dates. After an external review: relabeled the delay cost as
an exposure estimate rather than a lower bound, described percentiles as
historical reference points, added a downloadable scenario record
(criteria are saved when a selection is applied, so the record always
matches its results), and stated that the direction of the remaining
selection bias is unknown.*

© 2024–2026 Steven Ponce · Built with R + Quarto

Source Issues