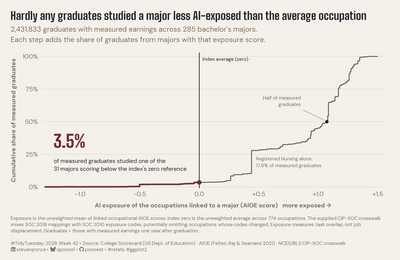
Hardly any graduates studied a major less AI-exposed than the average occupation
TidyTuesday
2026
Oct 19, 2026
Clinical trial analytics · Data visualization · R
I turn clinical trial data into clear, early signals, and share weekly data visualizations built in R, with the code behind them.
Recent visualizations
See all →About
By day, I’m a Senior Manager and Clinical Trial Risk Analyst in Clinical Trial Risk Management at Bristol Myers Squibb in New Jersey, after nearly a decade at Pfizer. My work centers on risk-based monitoring and early signal detection across clinical trials. Views here are my own.
Outside work, I take part in community challenges (TidyTuesday, MakeoverMonday, SWD Challenge and the 30DayChartChallenge) and publish each chart with its R code, plus the occasional lesson learned in Behind the Viz.